Android Question How to represent this information on a bargrap and curve

Makumbi

Well-Known Member
Licensed User
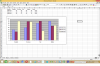
Good evening members iam trying to display this information on a bar and curve chart please help me out thanks in advance
Find attached my small attachment for the project and the excel graph that i want to display
below is my other code
B4X:
#Region  Project Attributes
    #ApplicationLabel: BarChart
    #VersionCode: 1
    #VersionName:
    'SupportedOrientations possible values: unspecified, landscape or portrait.
    #SupportedOrientations: unspecified
    #CanInstallToExternalStorage: False
#End Region

#Region  Activity Attributes
    #FullScreen: False
    #IncludeTitle: True
#End Region

Sub Process_Globals

End Sub

Sub Globals
    Private xui As XUI
    Private BarChart, LineChart As xChart
End Sub

Sub Activity_Create(FirstTime As Boolean)
    Activity.LoadLayout("Main")
    

        FillCharts

End Sub

Sub Activity_Resume

End Sub

Sub Activity_Pause (UserClosed As Boolean)

End Sub

Private Sub FillCharts
    'Private Name As String
    Private lstTotal, lstSubject,lstName As List
    Private ResultSet1 As ResultSet
    Private Query As String
    
    lstTotal.Initialize
    lstSubject.Initialize
    lstName.Initialize
    'Name = "MAKUMBI TARIQ AZIZI"
    'Query = "SELECT Names, Total, Subject FROM Academics WHERE Names = ?"
    Query = "SELECT Names, Eng,Science,Sst,Maths,Years from students"
    
    'ResultSet1 = Starter.SQL1.ExecQuery2(Query, Array As String(Name))
    ResultSet1 = Starter.SQL1.ExecQuery(Query)
    Do While ResultSet1.NextRow
    
        lstSubject.Add(ResultSet1.GetString("Names"))
        lstSubject.Add(ResultSet1.GetString("Years"))
        lstTotal.Add(ResultSet1.GetString("Eng"))
        lstTotal.Add(ResultSet1.GetString("Science"))
        lstTotal.Add(ResultSet1.GetString("Sst"))
        lstTotal.Add(ResultSet1.GetString("Maths"))
    Loop

    'Bar chart
    BarChart.ClearData
    BarChart.AddBar("marks", xui.Color_RGB(139, 132, 255))
    For i = 0 To lstSubject.Size - 1
        BarChart.AddBarPointData(lstSubject.Get(i), lstTotal.Get(i))
    '    Total = Total + Value(i)
    Next
    BarChart.YAxisName = "marks"
'    BarChart.XAxisName = "total marks = " & Total
    BarChart.DrawChart
    
    'Line chart
    LineChart.ClearData
    LineChart.AddLine("marks", xui.Color_Blue)
'    LineChart.AddLine2("marks", xui.Color_Blue, 2dip, "SQUARE", False, xui.Color_Blue)
    For i = 0 To lstSubject.Size - 1
        LineChart.AddLinePointData(lstSubject.Get(i), lstTotal.Get(i), True)
    Next
    LineChart.YAxisName = "marks"
    LineChart.DrawChart
End Sub

B4X:
    Query = "CREATE TABLE Students (Names Text, Eng text,Science Text ,Sst Text,Maths Text,Years Text ,ID INTEGER NOT NULL PRIMARY KEY AUTOINCREMENT UNIQUE)"
        SQL1.ExecNonQuery(Query)
        Query = "INSERT INTO Students VALUES ('Sulaiman', '50','60','80','90','2019','1')"
        SQL1.ExecNonQuery(Query)
        Query = "INSERT INTO Students VALUES ('Sulaiman', '40','88','90','67','2019','2')"
       
        SQL1.ExecNonQuery(Query)
        Query = "INSERT INTO Students VALUES ('Sulaiman', '90','87','44','70','2020','3')"
 

Attachments

  • Backup BarChart 2020-03-13 22.50.zip
    32.4 KB · Views: 162
  • Graphs.png
    Graphs.png
    89.6 KB · Views: 169
Last edited:

klaus

Expert
Licensed User
Longtime User
Here you are.
Attached the modified project, I made also some modifications in your database.
Changed the Eng, Science, Sst and Maths column data type to INTEGER instead of TEXT. If the marks can also be decimal numbers you should set REAL
You have two entries with the same year, the only differences is the ID which doesn't mean something concrete. I added a Semester column to the database.
You need to understand what you want to display and how and then understand what data to get from the database and how.
I changed also the display of the data, different from your example, it's more logical in my mind.

1584273607386.png
 

Attachments

  • Backup BarChart 2020-03-15.zip
    29.2 KB · Views: 166
Upvote 0

Makumbi

Well-Known Member
Licensed User
Here you are.
Attached the modified project, I made also some modifications in your database.
Changed the Eng, Science, Sst and Maths column data type to INTEGER instead of TEXT. If the marks can also be decimal numbers you should set REAL
You have two entries with the same year, the only differences is the ID which doesn't mean something concrete. I added a Semester column to the database.
You need to understand what you want to display and how and then understand what data to get from the database and how.
I changed also the display of the data, different from your example, it's more logical in my mind.

View attachment 90047
Klaus thank you for this big effort . But in here for the fileld of semester the values i have are text values not numerical values because i have values like MIDTERM1, END TERM 1,MIDTERM 2, END TERM2 ETC Those are the values i have wen i trying changing your example to have the semester values change form integer to text i get zero instead
 
Upvote 0

klaus

Expert
Licensed User
Longtime User
Without concrete information I have do improvise, therefore I used an INTEGER type.
But, for me, there is no problem to convert it to different String values..
... to have the semester values change form integer to text i get zero instead
Again without knowing what you have done, impossible to give a concrete advice.
You could set a correspondence between MIDTERM1, END TERM 1,MIDTERM 2, END TERM2 and numeric values.
It's often easier to handle numeric values instead of string values, eventhough String variables are better understandable, but with a correspondence between String and Int variables good correspondences can be made.
For the display, MIDTERM1, END TERM 1,MIDTERM 2, END TERM2, values may take quite some place.
Using 1, 2, 3 and 4 instead, take less place and are for sure also understandable.
 
Upvote 0

Mahares

Expert
Licensed User
Longtime User
MIDTERM1, END TERM 1,MIDTERM 2, END TERM2 ETC Those are the values i have wen i trying changing your example to have the semester values change form integer to text i get zero instead
In line of what klaus is thinking, you can create a map like this to correlate the terms text with numbers:
B4X:
Sub Activity_Create(FirstTime As Boolean)
    Activity.LoadLayout("Main")  
    If Not (File.Exists(File.DirInternal, "terms")) Then  'mahares
        Dim mp As Map
        mp.Initialize
        mp.Put("MID TERM 1",1)
        mp.Put("END TERM 1",2)
        mp.Put("MID TERM 2",3)
        mp.Put("END TERM 2",4)
        File.WriteMap(File.DirInternal,"terms",mp)
    End If  
    FillCharts
End Sub
then, at the beginning of FillCharts sub, you extract the values from the map:
B4X:
Private Sub FillCharts  
    Dim MyMap As Map    'mahares
    MyMap.Initialize
    MyMap=File.ReadMap(File.DirInternal,"terms")
   'rest of your code.....

lstSemesters.Add(ResultSet1.GetInt("Semester")) must change to this: lstSemesters.Add(ResultSet1.Getstring("Semester"))
Then the code to get the barchart bars, you extract the number (value) corresponding to the key as shown below from the map:
B4X:
For i = 0 To lstIDs.Size - 1 
        BarChart.AddBarMultiplePoint(lstYears.Get(i) & " - " & MyMap.Get(lstSemesters.Get(i)), Array As Double(lstMarksEng.Get(i), lstMarksScience.Get(i), lstMarksSst.Get(i), lstMarksMaths.Get(i)))
    Next
When you plot the graphs you will get the numbers instead of the text. For instance: END TERM 1 will show up as 2 and so on, to make it easier to read the graphs. If you want to see klaus's project after I changed it, I can post it. DO not forget to change the semester to text when you create the table: Semester TEXT
 
Last edited:
Upvote 0
Top