Hi
I try to create jqplot component. The bar chart cann't plot because the var plot2 is undefine. Do you know what is happen ?
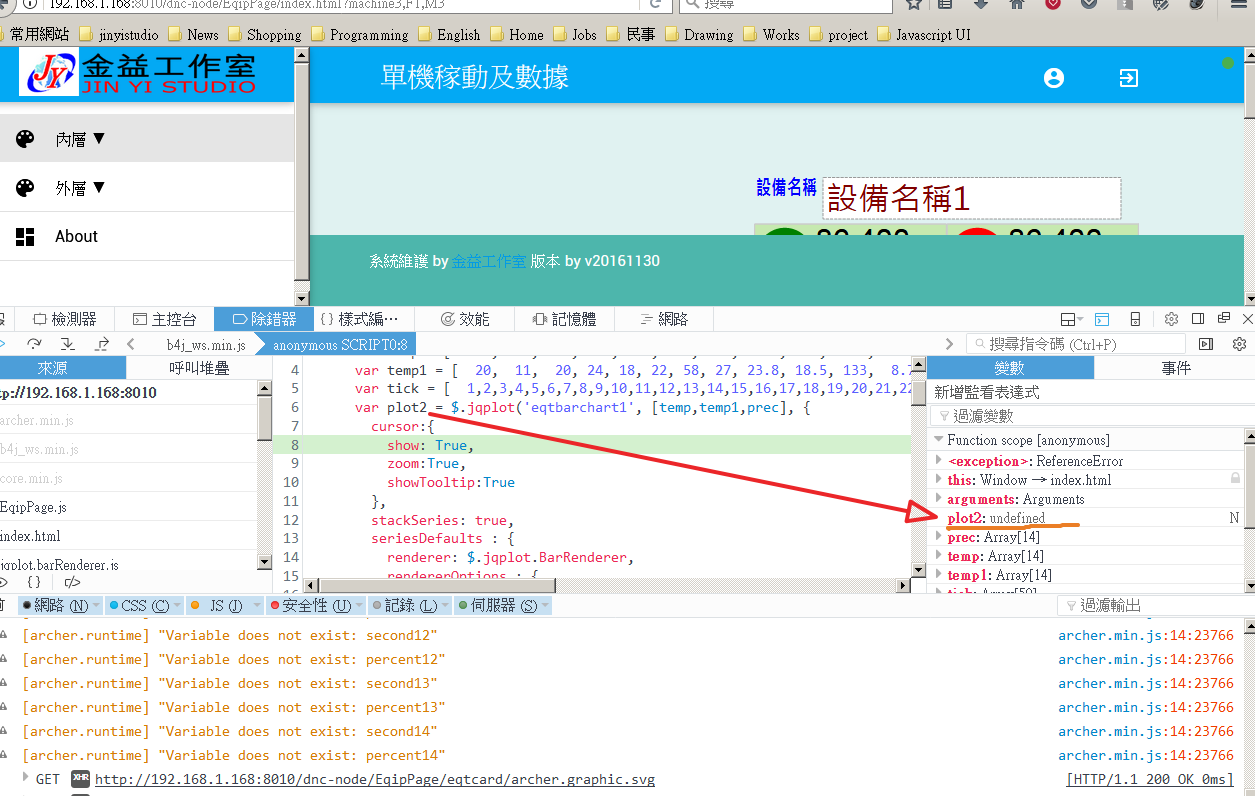
I try to create jqplot component. The bar chart cann't plot because the var plot2 is undefine. Do you know what is happen ?
B4X:
private Sub ABMComp_Build(internalID As String) As String
  Return $"<script></script></div>"$
End Sub
' Is useful to run some initalisation script.
private Sub ABMComp_FirstRun(InternalPage As ABMPage, internalID As String)
    Dim script As String = $"
            var prec = [ 52.3, 56.1,117.5,124.5,137.8,167.7,153.5,168.2,10000,197.8, 92.5, 51.0,200,400 ];
            var temp = [  100,  65,  94, 146, 189, 221, 258, 27.4, 238, 18.5, 13.3,  8.7,5,2 ];
            var temp1 = [  20,  11,  20, 24, 18, 22, 58, 27, 23.8, 18.5, 133,  8.7,5,2 ];
            var tick = [  1,2,3,4,5,6,7,8,9,10,11,12,13,14,15,16,17,18,19,20,21,22,23,24,25,26,27,28,29,30,31,32,33,34,35,36,37,38,39,40,41,42,43,44,45,46,47,48,49,50];
            var plot2 = $.jqplot('${internalID}', [temp,temp1,prec], {
                cursor:{
                    show: True,
                    zoom:True,
                    showTooltip:True
                },
                stackSeries: true,
                seriesDefaults : {
                    renderer: $.jqplot.BarRenderer,
                    rendererOptions : {
                        barWidth: 16
                    }
                },
                series:[
                    {
                        yaxis:'yaxis'
                    },
                    {
                        yaxis:'yaxis'
                    },
                    {
                        yaxis:'y2axis',
                        disableStack : true,
                        renderer: $.jqplot.LineRenderer
                    }
                ],
                axesDefaults: {
                    tickRenderer: jQuery.jqplot.CanvasAxisTickRenderer,
                    tickOptions: {
                        angle: 0,
                        fontSize: '10pt'
                    }
                },
                axes: {
                    xaxis: {
                        renderer: $.jqplot.CategoryAxisRenderer,
                        tickOptions: {
                            angle: 40,
                            fontSize: '10pt',
                            formatter: function(format, value) { return '00:' + value; }
                        },
                        ticks: tick
                    },
                    yaxis: {
                        tickOptions: { formatString: "%'d" },
                        min: 0,
                        tickInterval: 90,
                        numberTicks: 10,
                        rendererOptions: { forceTickAt0: true }
                    },
                    y2axis: {
                        tickOptions: { formatString: "%'d" },
                        min: 0,
                        numberTicks: 10,
                        rendererOptions: { forceTickAt0: true }
                    }
                },
                highlighter: {
                    show: true,
                    fontSize: '18pt',
                    sizeAdjust: 14
                },
                cursor: {
                    show: true,
                    tooltipLocation:''
                }
            }); "$

    InternalPage.ws.Eval(script, Array As Object(ABMComp.ID))
End Sub