FAST
faster then Jqplot and chartist js plugin. Loads in a second
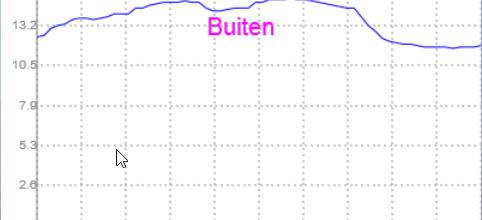
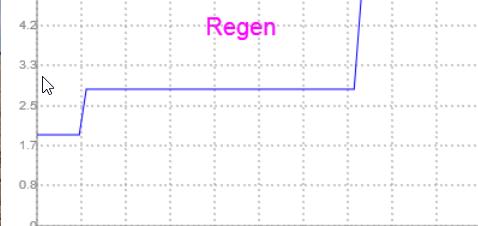
for my domotica meteostation i needed graphics. The old java applets are banned. Firefox doesnt even support it anymore, so i went to ABmaterial searching a way to get those charts back.
results is a nice UI and fast loading graphics.
call it in the connectpage:
faster then Jqplot and chartist js plugin. Loads in a second
for my domotica meteostation i needed graphics. The old java applets are banned. Firefox doesnt even support it anymore, so i went to ABmaterial searching a way to get those charts back.
results is a nice UI and fast loading graphics.
B4X:
Sub BuildGraphic(width As Int,height As Int,data() As Int,id As String) As ABMCanvasObject
   Dim grp As ABMCanvasObject
   Dim const xmarl=30 As  Int ''offset to the right of plot
   Dim const ymarl=10 As Int ''offset to the top of plot
   Dim const  xmarr=10 As Int
   Dim const ymart=15 As Int
   Dim const markers=10 As Int  ''number of markers x
   Dim const markersy=6 As Int  ''number of vertical markers
   Dim sx As Double
   Dim minv=0 As Double
   Dim maxv=-9999 As Double
   Dim scaley=0 As Double

   grp.fillStyleColor("#ff00ff")
   grp.font("arial", 20)
   grp.textBaseline(ABM.CANVAS_TEXTBASELINE_MIDDLE)
   grp.textAlign(ABM.CANVAS_TEXTALIGN_CENTER)
   grp.fillText(id, width/2, 25)

   'scan max and min value
   For x=0 To 63
     If data(x)>maxv Then maxv=data(x)
     If data(x)<minv Then minv=data(x)
   Next
   'set scalefactor

   If maxv-minv=0 Then
     scaley=1
   Else
     minv=minv/10
     maxv=maxv/10
     scaley=(height-ymarl-ymart)/(maxv-minv)
     scaley=scaley/10
   End If
   ' add the timelabels
   DateTime.TimeFormat="HH:mm"
   Dim offset=DateTime.TicksPerMinute*63*markers As Long
   'x axis
   grp.textAlign(ABM.CANVAS_TEXTALIGN_RIGHT)
   grp.fillStyleColor("#888888")
   grp.strokeStyleColor("#888888")
   grp.beginPath
   grp.moveTo(xmarl,height-ymarl)
   grp.lineTo(width,height-ymarl)
   grp.stroke
   grp.font("arial", 10)

   For x=0 To markers
     sx=xmarl+(width-xmarl-xmarr)*x/markers
     DrawDottedLine(grp,sx,height-ymarl,sx,ymart,0.1,height/5)
     grp.fillText(DateTime.Time(DateTime.now-offset*(markers-x)/markers), sx, height-ymarl/2)
   Next
'   ý axis
   grp.textAlign(ABM.CANVAS_TEXTALIGN_RIGHT)
   For x=0 To markersy
     sx=height-ymarl-height*x/markersy
     grp.fillText(NumberFormat((maxv-minv)*x/markersy+minv,1,1), xmarl, sx)
     DrawDottedLine(grp,xmarl,sx,width-xmarr,sx,0.1,width/5)

   Next
   'paint 0 line if needed (temp below 0)
   If minv<0 Then

'     grp.fillStyleColor("#000000")
     grp.beginPath
     sx=height -  ymarl+minv*scaley
     grp.moveTo(xmarl,sx)
     grp.lineTo(width,sx)
     grp.strokeStyleColor("#ff0000")
     grp.stroke
     grp.fillText(0, xmarl, sx)
   End If
   'paint the graph

   Dim spy=height-xmarl As Double
   grp.beginPath
   spy=height - data(0)*scaley - ymarl+minv*scaley
   grp.moveTo(xmarl,spy)
   Dim x As Int

   For x=1 To 63
     spy=height - data(x)*scaley - ymarl+minv*scaley
     grp.lineTo(xmarl+(width-xmarl-xmarr)*x/63,spy)
   Next
   grp.strokeStyleColor("#0000ff")
   grp.lineWidth(1)
   grp.stroke
   Return grp
End Sub
call it in the connectpage:
B4X:
  Dim graphic1 As ABMCanvasObject = BuildGraphic(400,200,Main.meteovalues.p_regen,"Regen")
   canvas8.AddObject(graphic1)
Last edited: