Edit 6 Sep 2015: Post #3 adds Single Vertical Bar Charts and update for Pie Charts
Edit 8 Sep 2015 Post #6 update for Single Vertical Bar Charts
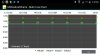
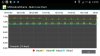
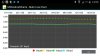
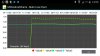
Edit 11 Sep 2015 Post #7 adds Single Line Charts
Edit 12 Sep 2015 Post #8 update for Single Line Charts
Edit 12 Sep 2015 Post #9 adds Single Horizontal Bar Charts
Edit 12 Sep 2015 Post #11 adds Radar Charts
Edit 13 Sep 2015 Post #12 update for Single Line and Single Bar Charts
Edit 14 Sep 2015 Post #16 update for Radar Charts
Edit 16 Sep 2015 Post #19 adds Multiple Line Charts
Edit 17 Sep2016 Post #21 adds Multi Vertical Bar Charts
Edit 19 Sep 2015 Post #23 adds Multi Bubble Charts
Edit 19 Sep 2015 Post #24 adds Multi Horizontal Bar Charts
Edit 19 Sep 2015 Post #25 adds Multi Scatter Charts
Edit 19 Sep 2015 Post #26 adds Stacked Bar Charts
Edit 20 Sep 2015 Post #27 adds Candlestick Charts
Edit 20 Sep 2015 Post #28 adds Combined Line & Bar Charts
Edit 23 Sep 2015 Post #31 fixed no-show of Chart Title for Combined Charts and added ability to rotate X-axis labels between -30 and + 30 degrees
I am busy wrapping this Github project. Attached is the Pie Chart functionality of the project/library. Posting the B4A project and Library files. Copy the library files to your additional library folder.
Some remarks about the Pie Chart:
1. It will display the values passed as a percentage of the total of the values that you pass
2. There are 3 x arrays that are passed to the library. Ensure that you pass the same number of elements in each of the arrays.
3. When you click on a pie slice the slice will increase in radial size (see pics below)
4. If you click on the radial increased slice it will return to normal size.
5. You can spin the pie chart around its centre point (CW and ACW) with your finger.
Untouched ...


Green slice touched ...

Pie Chart rotated with finger...

Some sample code:
Edit 8 Sep 2015 Post #6 update for Single Vertical Bar Charts
Edit 11 Sep 2015 Post #7 adds Single Line Charts
Edit 12 Sep 2015 Post #8 update for Single Line Charts
Edit 12 Sep 2015 Post #9 adds Single Horizontal Bar Charts
Edit 12 Sep 2015 Post #11 adds Radar Charts
Edit 13 Sep 2015 Post #12 update for Single Line and Single Bar Charts
Edit 14 Sep 2015 Post #16 update for Radar Charts
Edit 16 Sep 2015 Post #19 adds Multiple Line Charts
Edit 17 Sep2016 Post #21 adds Multi Vertical Bar Charts
Edit 19 Sep 2015 Post #23 adds Multi Bubble Charts
Edit 19 Sep 2015 Post #24 adds Multi Horizontal Bar Charts
Edit 19 Sep 2015 Post #25 adds Multi Scatter Charts
Edit 19 Sep 2015 Post #26 adds Stacked Bar Charts
Edit 20 Sep 2015 Post #27 adds Candlestick Charts
Edit 20 Sep 2015 Post #28 adds Combined Line & Bar Charts
Edit 23 Sep 2015 Post #31 fixed no-show of Chart Title for Combined Charts and added ability to rotate X-axis labels between -30 and + 30 degrees
I am busy wrapping this Github project. Attached is the Pie Chart functionality of the project/library. Posting the B4A project and Library files. Copy the library files to your additional library folder.
Some remarks about the Pie Chart:
1. It will display the values passed as a percentage of the total of the values that you pass
2. There are 3 x arrays that are passed to the library. Ensure that you pass the same number of elements in each of the arrays.
3. When you click on a pie slice the slice will increase in radial size (see pics below)
4. If you click on the radial increased slice it will return to normal size.
5. You can spin the pie chart around its centre point (CW and ACW) with your finger.
Untouched ...
Green slice touched ...
Pie Chart rotated with finger...
Some sample code:
B4X:
#Region  Project Attributes
    #ApplicationLabel: MPChart
    #VersionCode: 1
    #VersionName:
    'SupportedOrientations possible values: unspecified, landscape or portrait.
    #SupportedOrientations: landscape
    #CanInstallToExternalStorage: False
#End Region

#Region  Activity Attributes
    #FullScreen: False
    #IncludeTitle: True
#End Region

Sub Process_Globals
    'These global variables will be declared once when the application starts.
    'These variables can be accessed from all modules.

End Sub

Sub Globals
    'These global variables will be redeclared each time the activity is created.
    'These variables can only be accessed from this module.

    Private mpc1 As PieChart
End Sub

Sub Activity_Create(FirstTime As Boolean)
    'Do not forget to load the layout file created with the visual designer. For example:
    Activity.LoadLayout("main")

mpc1.DrawHoleEnabled = True
mpc1.HoleColorTransparent = True

mpc1.TransparentCircleColor = Colors.White
mpc1.TransparentCircleAlpha = 110

mpc1.HoleRadius = 58.0
mpc1.TransparentCircleRadius = 61.0

mpc1.DrawCenterText = True

mpc1.CenterText = "Wrapped by Johan"
mpc1.CenterTextColor = Colors.White
mpc1.CenterTextRadiusPercent = 100.0
mpc1.CenterTextSize = 15.0

mpc1.DrawSliceText = True
mpc1.HoleColor = Colors.Black
mpc1.TransparentCircleColor = Colors.Transparent

mpc1.setTheLegendPosition
mpc1.TheLegendColor = Colors.yellow
mpc1.TheLegendTextSize = 12.0
mpc1.LegendTitle = "MONTHS"

mpc1.ChartDescription = "TITLE : Some Arbitrary Data"
mpc1.ChartDescriptionColor = Colors.ARGB(200,0,255,255)
mpc1.ChartDescriptionTextSize = 17

mpc1.ValueTextColor = Colors.Black
mpc1.ValueTextSize = 15.0

mpc1.PieColors = Array As Int(Colors.Blue, Colors.Yellow, Colors.Green, Colors.Red, Colors.Magenta, Colors.Cyan)
mpc1.LegendText = Array As String("Jan", "Feb", "Mar", "Apr", "May", "Jun")
mpc1.ChartData = Array As Float(128.0, 16.0, 46.0, 40.0, 30.0, 40.0)    'values - it will be converted to %

mpc1.PieData = 6

End Sub

Sub Activity_Resume

End Sub

Sub Activity_Pause (UserClosed As Boolean)

End Sub
Attachments
-
b4aMPChart.zip7.9 KB · Views: 1,414
-
mpChartLibraryFiles.zip221.5 KB · Views: 1,503
-
mpChartLibV1.15.zip355.2 KB · Views: 616
-
mpChartLibV1.16.zip355.7 KB · Views: 616
-
mpChartLibV1.17.zip355.8 KB · Views: 784
-
mpChartLibV1.18.zip356.4 KB · Views: 696
-
mpChartLibV1.20.zip358.1 KB · Views: 478
-
mpChartLibV1.21.zip358 KB · Views: 50
-
mpChartLibV1.22.zip359.2 KB · Views: 78
Last edited:
")