B4J Question Problem with googlemaps handling polygons

bvonlaar

Member
Licensed User
Longtime User
Hello,
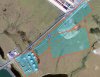
I read GPS-position data in and display points, lines and polygons in Googlemaps. Normally the origin of data are from real in field collected data. In addition to the field data I build also a csv-editor so it is possible to add points, lines and polygons also at home.

The manual input is done with addmarker. But this don´t work if I try to set a marker in the area of an
existing polygon. The mouse pointer change from pointer to the hand which appears also in the GooglemapsExample if you move the mouse on a marker.
It seems that Googlemaps recognize whether the mouse is inside of a polygon and block the addmarker function by mouseclick.
With addmarker function I read out the GPS-position which is stored in the csv-file.
Has anyone an idea how I can force the setting of points inside of a polygon.
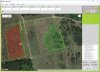
If I read different csv-data in then I have no problems to place a smaller polygon inside of a bigger one.

Benedikt
 

bvonlaar

Member
Licensed User
Longtime User
You can add a Polyline instead of Polygon.

This was also my thinking that I differ in edit mode and presentation mode. Because when I use Polyline then I can´t set fillcolor and opacity for an area, right? I hoped that there exist also another way.
Is it possible to work with a transparent overlay and connect the x/y-mouse position with the x/y-mouse position in Googlemaps?

Thanks,
Benedikt
 
Upvote 0

Erel

B4X founder
Staff member
Licensed User
Longtime User
Upvote 0

bvonlaar

Member
Licensed User
Longtime User

Well, this link shows how to get the GPS-coordinates. How can I get in addition to this the x/y values in pixels also. If I would get both infos (gps coordinates and
x/y value in pixel then I could try to work with a transparent overlay to overcome the polygon problem. This way would have another good side effect. I could try to geo reference also air pictures done with drones. (I work with normal picture like GoogleEarth and IR picture from the drone, the collected point field data by B4A are in both cases the same)
If you think that this is a dead end then I use the polyline way.

Benedikt
 
Upvote 0

Harris

Expert
Licensed User
Longtime User
When creating a new polygon, clear all existing from view. That way, there will be nothing to interfere with the new creation.
In my situation, my polygons never overlap. I am trying to determine when a device is within a polygon. If they overlapped, it could be within both at the same time - but what rules are applicable for the ploy (do I warn, do I record an event, etc)? Your situation may be different.
 
Upvote 0

bvonlaar

Member
Licensed User
Longtime User
When creating a new polygon, clear all existing from view. That way, there will be nothing to interfere with the new creation.
In my situation, my polygons never overlap. I am trying to determine when a device is within a polygon. If they overlapped, it could be within both at the same time - but what rules are applicable for the ploy (do I warn, do I record an event, etc)? Your situation may be different.

I think my situation is quite different. I use it for discription of landscape and their elements/structure. So I have first the dimension of an area of research. Inside of this polygon I have different informations of different clusters with different types of vegetation. Special types of soil could also be of interest. This is a collection of possible polygons. Then the found points of some facts are added like bird species, reptiles or explanation labels etc.
Only the manual graphic input in the editor cause some trouble. Like Erel said, I can solve this by using polyline in the editor mode. Another way to solve it, which has also some very interest side effects, is to work with a transparent overlay and stamp the coordinates to the googlemaps layer. But I don´t know whether it is possible.
If this way is thinkable then an additional option is possible the geo referencing of drone air pictures.
And the complete background of all is to create a tool for enthusiasts and semi professionals where Quantum GIS (QGIS) is to fat and for people with reduced map services.
The intention is to build a free tool for simple and quick displaying collected field data.

So, I need to know whether the second way is possible otherwise I have only the option with polyline.

Benedikt
 
Upvote 0

Harris

Expert
Licensed User
Longtime User
Yes, actually I use polyline when creating a polygon (after reviewing my code).
I could not use AddPolygon since I don't yet have the list of markers - yet - in the process of creating them.
I display the saved points as a polygon. The first lat/lon (marker) and the last lat/lon are exactly the same point - which creates the polygon.
Don't know about layers - never worked with them.

B4X:
Sub gm1_Clicked(Latitude As Double, Longitude As Double)  ' ABMaterial google map clicked event

    If pntedit Then ' if editing a previously created polygon point placement
       
        Dim str1 As String = NumberFormat2(Latitude,0,6,6,False)
        Dim str2 As String = NumberFormat2(Longitude,0,6,6,False)
        Dim lat1 As Double = str1
        Dim lon1 As Double = str2
       
        gm1.AddMarker("newmarker" , str1, str2, ABM.COLOR_BLUE, "New", "")
        gm1.refresh ' IMPORTANT
        Log("Marker: "&lat1&"   "&lon1)
       
        Dim SQL As SQL = DBM.GetSQL
        SQL.ExecNonQuery2("UPDATE zonedet set lat = ?,lon = ? where pk = ?",Array As Object(lat1,lon1,sel_pnt))  ' update the old point to new location
        DBM.CloseSQL(SQL)
'        Toast(" Select Zone Name to Refresh This Item",3000)
        Checkselected(lat1,lon1)
        tblcases_clicked(rclist)
        'pntedit = False
    End If
   

    If pntnew Then ' if creating a new polygon from scratch
       
        Dim str1 As String = NumberFormat2(Latitude,0,6,6,False)   ' force to six decimal place
        Dim str2 As String = NumberFormat2(Longitude,0,6,6,False)
        Dim lat1 As Double = str1   ' convert back to double (probably not needed)
        Dim lon1 As Double = str2
       
        gm1.AddMarker("newmarker" , str1, str2, ABM.COLOR_BLUE, "New", "")
        Markers.Add(lat1)
        Markers.Add(lon1)
        Mark.Put(lat1,lon1)
       
        gm1.RemovePolyLines  ' remove what was created so far
        gm1.AddPolyLine(Markers, ABM.COLOR_DEEPORANGE, ABM.INTENSITY_NORMAL, 0.6, 5)  ' redraw all Markers 
       
        gm1.refresh ' IMPORTANT
    End If
   
   
End Sub
 

Attachments

  • zones.jpg
    zones.jpg
    259.9 KB · Views: 341
Upvote 0

bvonlaar

Member
Licensed User
Longtime User
Well, I think however I decide I have to operate with polyline as interim step. In the attached picture you see a screenshot of my program. You see a inner green area. In my APP I have also to describe the development of landscape over the time. In general I start with a satellite picture. With this way I have a calibrated air picture. The negative aspect of Googlemaps is that the most picture are some years old. Actual views I generate with drones, but this pictures are uncalibrated and so I have the problem to blend in the field collected point and polygon data. So, if I could work with an overlay (first attempt with a transparent overlay and connect the overlay input with the positions of
Googlemaps then I could manual generated polygons/polylines add. After generation is finish I read in this new csv-file and display as polygon. So, if I could use this way then I don´t need to use absolutly a transparent overlay. The overlay could also be a container of a drone picture and it would be easy to calibrate. I would have only to adapt the right orientation. So it would be possible to visualize the development of area over the time)

The accuracy don´t need to be absolute.


Benedikt
 

Attachments

  • GeoLogViewer02.jpg
    GeoLogViewer02.jpg
    245.3 KB · Views: 335
Upvote 0
Top