“User Engagement” is not merely a marketing term. It’s an approach to set up long lasting relationship with users by delivering them greater values through brilliant mobile applications. The cycle of mobile app development is incomplete without channelized marketing efforts.
The user engagement metrics help businesses to track users’ behavior with the application and accordingly make the required changes in terms of design, development, navigation, etc. I, myself have been struggling for retention every now and then. So, Here’re a few most important metrics that every appreneurs should know.
#1. App Downloads
As of March 2017, Google’s Play Store holds a primary position with 2.8 million apps and Apple’s App Store remained second largest with 2.2 million apps. — Statista
While you have such a great number of competitors, it’s quite tough to get prime visibility in the app store to entice users and improve app downloads. If you are dealing with less or no downloads, re-strategize your marketing tricks to improve the app store ranking be following best app store optimization practices for the App Store and Play Store. App owners can also utilize versatile marketing tactics such as such as app landing page creation, distinctive app name selection, conceptual logo designing, etc. to increase the installs.
#2. Active Users
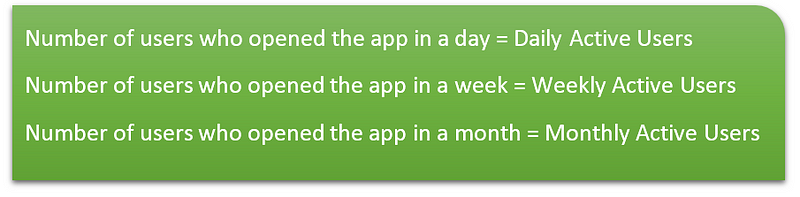
Active users are different from the people who have just installed the app. They are using the app regularly. It counts each individual who is using your app, but not the number of sessions. Each user counted just one time, regardless of how many times a user access the app in a day.
Weekly active users hold the similar concept like daily active users. The only difference is, it unveils the unique numbers how many users used the app in the given week or in last 7 days.
Monthly active users metric is also quite alike. However, it shows the monthly count how many people have used the app in the last 30 days or in a given month.
#3. Total Number of Users
Appreneurs have to engage the users’ through the consistent launch of app marketing campaign, audience segmentation, and specific behavior tracking. The total number includes daily active users, weekly active users, and monthly active users. Furthermore, companies can divide the app users as per their devices, demographic, gender, age, and more. Analysis of these different numbers enables app owners to plan out the growth of your app.
#4. Screen Flow
Screen flow metric offers analysis of the total number of visits on each mobile screen. It provides a clear idea about users’ navigation flow between different screens and a number of exits from each screen. Track the users’ behavior on each screen, gain profound insights about their activities on a particular screen, and accordingly refine the navigation pattern of your mobile app.
Detailed analysis of users’ navigation flow helps in identifying the problem area, conversation road bump, and drop-off screens. It also facilitates the users to redesign and/or redevelop the app and run effective marketing campaigns to regain the dropped users.
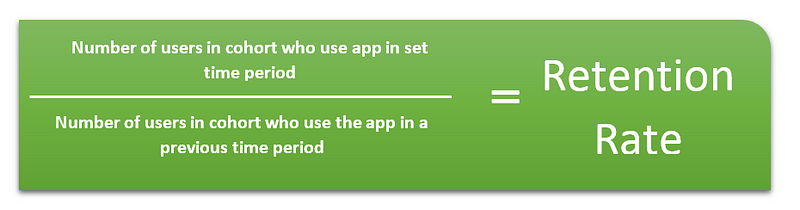
#5. Retention Rate
Retention rate is the percentage of how many users return to the app in last 30 days. It displays the stickiness and addition of users with the app. Make a few changes in your app onboarding to recognize who are your valuable customers who are using your app. Understand users’ behavior and accordingly upgrade your app to engage and retain them for long-term. Attract the users by delivering an extremely customized app experience and greater benefits. If we consider the increasing cost of installs, retaining the users is a better option rather than acquiring the new.
#6. Session Interval
Session interval metric allows tracking how frequently the users come to the mobile application. Ideally, the app session interval should be short. It proves that the users like to visit your app again and again. Smaller session interval depicts that the app is an integral part of the users’ routine. Make your mobile app more intuitive so users can connect and interact with it. Embrace contextual push notifications, an incredible app marketing strategy, to engage users more than normal rate. Also, you can send them frequent discounts, offers, updates of new features and functionality, etc. to remind users to pop back into the app.
#7. Session Length
It is a time duration between the opening and closing of the app by users. It also allows to track what activities users perform during that particular time. Longer session duration means more engagement. A number of sessions per day also help app owners to identify the customer base who spend more time on the app. The app owner can redefine the app features and functionality to attract and engage those users who spend less time on the app.
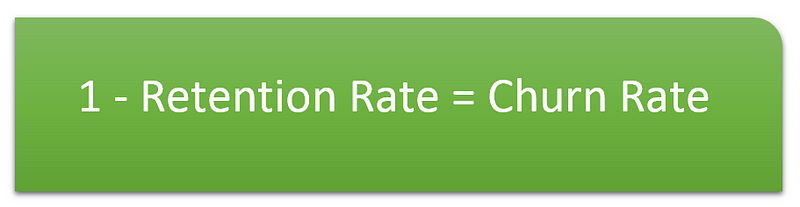
#8. Churn Rate
Another important metric that every Appreneur has to consider. It provides the percentage of users who close the app and never use it again. Basically, it’s the drop-off in retention that helps app owners to identify where the users are churning.