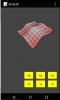
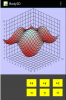
I have the need for a 3D surface chart, to show a two dimensional array of data values.
This is for a hobby project, for showing fuel and ignition timing tables. The data Z, would be indexed by X, Y.
Here is a javascript example using webGL. https://code.google.com/p/webgl-surface-plot/
I will pay $100 USD via paypal, for one working example in b4a.
I will share with b4x members. If $100 is not enough for work required, perhaps others with 3D chart needs, will help contribute too.