Hello,
I am trying to develop my first official android application and have undertaken a project for the same. Ive have had fun so far learning b4a nuances.(forgive me if i am being an idiot as regards b4a :sign0144")
First let me explain my hardware part:
This consists of a ucontroller testing module that will send voltage and current values successively (i believe in ASCII format) with a word tag at the end like so- 'number'V 'number'I (next iteration) 'number'V 'number'I (next iteration) and so on...
The ucontroller i am using is pic18f46xx
This will happen only when i press a button on my app which will send a signal to ucontroller to begin that particular subroutine and send data only after that.
What ive done and know so far:
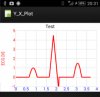
I have been able to study existing programs and using tutorials like Asyncstream and bluetooth chat i am able to receive the data on my phone and see it on the phone in the format i mentioned above. I also understand how to plot a graph using 'plot' and 'canvas' as well as i have help from existing tutorials.
Heres what i havent been able to do:
My basic aim is to plot these values on a graph, it can be live or passive(meaning data is stored first and then plotted or otherwise).
The beef being that i have no idea how to use the data coming from bluetooth or store it by separating the word tags 'v' or 'c' (in an array or such) and then use it to plot my graph. I have read all related tutorials for inspiration as well as other creations but to no avail.
:sign0163:
I request urgent help regarding this and appreciate any and all inputs i can get.
:sign0085:
Thanks and regards,
Raj.
I am trying to develop my first official android application and have undertaken a project for the same. Ive have had fun so far learning b4a nuances.(forgive me if i am being an idiot as regards b4a :sign0144
First let me explain my hardware part:
This consists of a ucontroller testing module that will send voltage and current values successively (i believe in ASCII format) with a word tag at the end like so- 'number'V 'number'I (next iteration) 'number'V 'number'I (next iteration) and so on...
The ucontroller i am using is pic18f46xx
This will happen only when i press a button on my app which will send a signal to ucontroller to begin that particular subroutine and send data only after that.
What ive done and know so far:
I have been able to study existing programs and using tutorials like Asyncstream and bluetooth chat i am able to receive the data on my phone and see it on the phone in the format i mentioned above. I also understand how to plot a graph using 'plot' and 'canvas' as well as i have help from existing tutorials.
Heres what i havent been able to do:
My basic aim is to plot these values on a graph, it can be live or passive(meaning data is stored first and then plotted or otherwise).
The beef being that i have no idea how to use the data coming from bluetooth or store it by separating the word tags 'v' or 'c' (in an array or such) and then use it to plot my graph. I have read all related tutorials for inspiration as well as other creations but to no avail.
:sign0163:
I request urgent help regarding this and appreciate any and all inputs i can get.
:sign0085:
Thanks and regards,
Raj.