I wanted a simple graphing function where I could define the range and intervals to sensible values but still have the luxury of the code determining the best fit from some derived values.
As long as the maximum X and Y values was less than the maximum predetermined X and Y ranges then the code selects the best fit graph outline. This is easy if say you are measuring a sensor and know the maximum range for argument sake
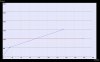
The code will select the best fit range and the predetermined intervals for that range, draw the graph outline and automatically label the X and Y intervals.
The graph size is user set, but reduced sizes will require alteration of the interval label sizes to stop clutter
An example of Multiple straight line point to point traces is provided
As long as the maximum X and Y values was less than the maximum predetermined X and Y ranges then the code selects the best fit graph outline. This is easy if say you are measuring a sensor and know the maximum range for argument sake
The code will select the best fit range and the predetermined intervals for that range, draw the graph outline and automatically label the X and Y intervals.
The graph size is user set, but reduced sizes will require alteration of the interval label sizes to stop clutter
An example of Multiple straight line point to point traces is provided