Problem with curve with module Charts

ciginfo

Well-Known Member
Licensed User
Longtime User
Hello,
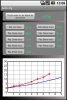
I created in my application attached a graph showing the weight of a person who weighs every month for 9 months.
Once a month the person is weighed and its weight recorded. The abscissa months, ordered to weight gain, and a reference curve.
I use the module "Charts" but I have two concerns:
1) If the person has weighed only 3 months the curve must stop at the third month, but with my code the curve continues until 9th month at 0.
2) If the person does not weigh one month, the curve has to continue without breaking the month in which it has not weighed.
If anyone can help me!
 

Attachments

  • Curves.zip
    10.9 KB · Views: 168

hdtvirl

Active Member
Licensed User
Longtime User
A simple way to do it might to have a variable called flt_lastEntry for instance and as the user inputs each month this variable also get updated, then as the user clcik on each button the previous months value should be checked to make sure it is not Zero and if it is zero then put the value from flt_lastEntry into the missing value that way you should always great a straight line across the missing month.


flt_lastEntry = pesee

There are a few other things you could do your code like have one event_clicked handle all of your buttons and use the button tag to identify wHich button was pressed that way you could have one click event handle each month. (something like a VB6 Control array)

I hope this helps

Regards

BOB
 
Upvote 0

ciginfo

Well-Known Member
Licensed User
Longtime User
I had founf other routine:
Dim i As Int
For i = 0 To 9
If Pds(i) = 0 Then
Poids2(i) = (Poids2(i-1)
End If
Next

But i don't want an horizontal straight line across the missing month, i want an oblique line connecting the data across the missing month.
And if for instance the 3 last months are not input i want the line stops and not a straight line across the missing month.
 
Upvote 0

hdtvirl

Active Member
Licensed User
Longtime User
ciginfo,

If you think about your problem yourself I think you have already come up with the solutions. Calculate the mid point between the two known values and then plot it on your chart as the missing value. If you are missing more than one months values, you will need to decide how you want to extrapolate the missing data.

Regards

BOB
 
Last edited:
Upvote 0

klaus

Expert
Licensed User
Longtime User
I am convinced that in your case the Chart utilities are not the best way to draw the graphics.
It would be much more efficient do write a specific drawing routine.

Attached you find your project with such a routine.

Two suggestions:
- You should add a check if the original weight is given, and if not 'force' the user to enter it.
- Change the color of the weight values. < 30 red >= 30 green, it gives a direct visual infomation on what weights are missing

The graphic stops at the last weight value > 0
The graph doesn't draw an intermediate point where the weight value is missing.
A circle is drawn aroind the points with weight values.

I have put all the button click events in one single routine.

Best regards.
 

Attachments

  • GraphPoids.zip
    12 KB · Views: 190
  • GraphPoids.jpg
    GraphPoids.jpg
    37.8 KB · Views: 228
Upvote 0

ciginfo

Well-Known Member
Licensed User
Longtime User
Klaus
This is excellent, although I have not understood all, so I decided to copy your code in full. But when it's a button that accesses the new page, it does not work and I have an error message.
pnlGraphique non initialized, it seems.
I can not understand why. I attach the file in question.
Thank you if you can explain me.
 

Attachments

  • GraphPoids.zip
    12 KB · Views: 163
Upvote 0

klaus

Expert
Licensed User
Longtime User
The file you attached is the project I sent you, so no possibility to find your problem.

The Panel pnlGraphique is in the layout file.
So if you load another layout you must either initialize pnlGraphique or add it to that layout.

Best regards.
 
Upvote 0
Top