This is regarding Klaus's "xChart": https://www.b4x.com/android/forum/threads/b4x-xui-xchart-class-and-b4xlib.91830/
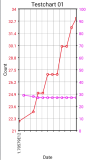
I want to create a chart that displays two data series simultaneously.

The problem is the labeling of the X-axis in a YX-chart.
The source data have a timestamp in the format long as X-value.
The X values of the two data series can be different.
In order to achieve the desired result, the X-axis labels must be specified in the format "dd.mm.yyyy".
How can this be done?
Testproject attached
I want to create a chart that displays two data series simultaneously.

The problem is the labeling of the X-axis in a YX-chart.
The source data have a timestamp in the format long as X-value.
The X values of the two data series can be different.
In order to achieve the desired result, the X-axis labels must be specified in the format "dd.mm.yyyy".
How can this be done?
Testproject attached
