Reuse of something I did in B4ppc days and got a round tuit now for B4a.
There are three libraries, doing similar thing with variations:
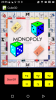
1. A 3D cube, with or without dice numbers on, can roll by touch or by command or provide a throw result by click.
2. A 3D library for any body, provided that you know how to define its verteces and polygons. There are examples of several bodies which may help, see photos.
3. A 3D library for any body (like 2 above), using Open_GL 1 library (thanks to Agraham). Note that I have very limited knowledge on the use of Open_GL and this implementation is very basic, however the user of this 3D library does not need any knowhow of Open_gl at all.
In all libraries you can create a view which is a base panel and the body on it. The panel may be transparent or with a bitmap.
A demo application is attached, including the bodies in the photos and a surprise.
The documentation is inherent and simple.
Important: The demo with the BodyGL library has some code with a timer - the specific item will fail when running in rapid debugger or even in legacy, but runs well in release mode (probably due to heavy load of Open_GL).
The three libraries use a coordinate system in which X is to the right, Y is up and Z is into the device. Flattened to 2D, z is diagonal from bottom-left to top-right.
The units of this system are much larger than the pixels, few units cover the display (depends on the z coordinate and the ViewAngle.
Edit: Cube3D updated to ver 1.01 , now its possible to define it as custom view.
see post 3 for details.
Edit: Ver 1.02 - CubeGL added , doing what Cube3D does but using openGL.
Cube3D and CubeGL both are also CustomView in the designer. See post #5 for details.
Edit: Frame line option added to BodyGL.
Edit: Body3D version is updated to 1.1, removing a limit of the number of points in a body and adding ViewAngle method. It is updated in 3D.zip file.
Edit: all libraries updayed to ver 1.2, inclusion of LineWidth method.
Note: The examples use openGL library , not updated to openGL2 !
There are three libraries, doing similar thing with variations:
1. A 3D cube, with or without dice numbers on, can roll by touch or by command or provide a throw result by click.
2. A 3D library for any body, provided that you know how to define its verteces and polygons. There are examples of several bodies which may help, see photos.
3. A 3D library for any body (like 2 above), using Open_GL 1 library (thanks to Agraham). Note that I have very limited knowledge on the use of Open_GL and this implementation is very basic, however the user of this 3D library does not need any knowhow of Open_gl at all.
In all libraries you can create a view which is a base panel and the body on it. The panel may be transparent or with a bitmap.
A demo application is attached, including the bodies in the photos and a surprise.
The documentation is inherent and simple.
Important: The demo with the BodyGL library has some code with a timer - the specific item will fail when running in rapid debugger or even in legacy, but runs well in release mode (probably due to heavy load of Open_GL).
The three libraries use a coordinate system in which X is to the right, Y is up and Z is into the device. Flattened to 2D, z is diagonal from bottom-left to top-right.
The units of this system are much larger than the pixels, few units cover the display (depends on the z coordinate and the ViewAngle.
Edit: Cube3D updated to ver 1.01 , now its possible to define it as custom view.
see post 3 for details.
Edit: Ver 1.02 - CubeGL added , doing what Cube3D does but using openGL.
Cube3D and CubeGL both are also CustomView in the designer. See post #5 for details.
Edit: Frame line option added to BodyGL.
Edit: Body3D version is updated to 1.1, removing a limit of the number of points in a body and adding ViewAngle method. It is updated in 3D.zip file.
Edit: all libraries updayed to ver 1.2, inclusion of LineWidth method.
Note: The examples use openGL library , not updated to openGL2 !
Attachments
-
Body3Demo.zip448 KB · Views: 1,169
-
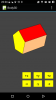 Prism3d.png11.2 KB · Views: 1,407
 -
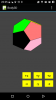 dode3d.png10.9 KB · Views: 1,384
 -
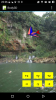 UAV3d.png139.8 KB · Views: 1,474
 -
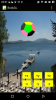 dode.png114.3 KB · Views: 1,403
 -
Cube3Demo.zip447.7 KB · Views: 1,004
-
CubeGlDemo.zip502.8 KB · Views: 1,055
-
 Cube3ddemo.png115.9 KB · Views: 1,419
 -
BodyGlDemo.zip62.8 KB · Views: 930
-
3D.zip37.6 KB · Views: 1,083
Last edited: