added to my Domotica system a bar chart
it might not fit exactly in your application, but all can modified. It works with a data array where electricity, gas and water data is loaded and plotted in 1 time.
call it in the connectpage
it might not fit exactly in your application, but all can modified. It works with a data array where electricity, gas and water data is loaded and plotted in 1 time.
B4X:
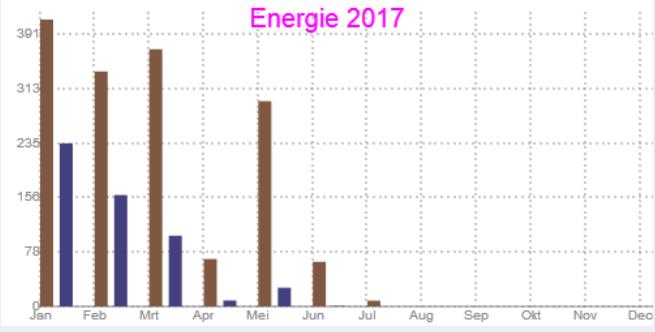
Sub BuildBar(width As Int,height As Int,data() As dta,id As String) As ABMCanvasObject
   Dim Bar As ABMCanvasObject
   Dim const xmarl=30 As  Int ''offset to the right of plot
   Dim const ymarb=15 As Int ''offset from the bottom of plot
   Dim const  xmarr=10 As Int
   Dim const ymart=15 As Int
   Dim const markers=11 As Int  ''number of markers x
   Dim const markersy=6 As Int  ''number of vertical markers
   Dim thick=10 As Int
   Dim sx As Double

   Dim maxv=-9999 As Double
   Dim scaley=0 As Double
   Dim const Monthlabel() As String=Array As String("Jan", "Feb", "Mrt", "Apr", "Mei", "Jun", "Jul","Aug", "Sep", "Okt", "Nov", "Dec")
   ' add the datelabels
   Bar.fillStyleColor("#ff00ff")
   Bar.font("arial", 20)
   Bar.textBaseline(ABM.CANVAS_TEXTBASELINE_MIDDLE)
   Bar.textAlign(ABM.CANVAS_TEXTALIGN_CENTER)
   Bar.fillText(id, width/2, 15)
'x axis
   Bar.textAlign(ABM.CANVAS_TEXTALIGN_CENTER)
   Bar.fillStyleColor("#888888")
   Bar.strokeStyleColor("#888888")
   Bar.beginPath
   Bar.moveTo(xmarl,height-ymarb)
   Bar.lineTo(width,height-ymarb)
   Bar.stroke
   Bar.font("arial", 10)

   For x=0 To markers
     sx=xmarl+(width-xmarl-xmarr)*x/markers
     DrawDottedLine(Bar,sx,height-ymarb,sx,ymart,0.1,height/5)
     Bar.fillText(Monthlabel(x), sx, height-ymarb/2)
   Next
   'scan max and min value
   For x=0 To 11
         If data(0).dtm(x)=0 Then data(0).dtm(x)=0
         If data(0).dtm(x)>maxv Then maxv=data(0).dtm(x)

   Next
'y axis
   Bar.textAlign(ABM.CANVAS_TEXTALIGN_RIGHT)
   For x=0 To markersy
     sx=height-ymarb-height*x/markersy
     Bar.fillText(NumberFormat(maxv*x/markersy,1,0), xmarl, sx)
     DrawDottedLine(Bar,xmarl,sx,width,sx,0.1,width/5)
   Next
   scaley=(height-ymarb-ymart)/maxv
   Dim spy=height-xmarl As Double
   Bar.beginPath
   Dim x As Int

   For x=0 To 11
     spy= -(data(0).dtm(x))*scaley
     Bar.beginPath
     Bar.fillStyleColor("#805740")
     Bar.rect(xmarl+(width-xmarl-xmarr)*x/11,height-ymarb,thick,spy)
     Bar.fill
     Bar.beginPath
     spy= -(data(1).dtm(x))*scaley
     Bar.fillStyleColor("#434080")
     Bar.rect(xmarl*3/2+(width-xmarl-xmarr)*x/11,height-ymarb,thick,spy)
     Bar.fill
   Next


   Return Bar
End Sub
call it in the connectpage
B4X:
    Dim graphic3 As ABMCanvasObject = BuildBar(500,250,dtj,"Energie 2017")
     canvas5.AddObject(graphic3)
     cont1.Cell(1,4).AddComponent(canvas5)