-
Welcome to B4X forum!
B4X is a set of simple and powerful cross platform RAD tools:
- B4A (free) - Android development
- B4J (free) - Desktop and Server development
- B4i - iOS development
- B4R (free) - Arduino, ESP8266 and ESP32 development
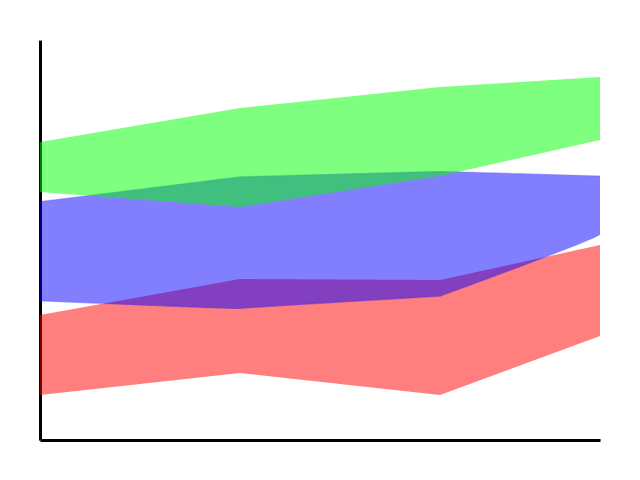
Android Question overlapping stacked area chart
- Thread starter ruut
- Start date
- Similar Threads Similar Threads
Similar Threads
- Article