Android Question Trying to implement xCharts

kanati

Member
Licensed User
Longtime User
I'm trying to implement xCharts and I'm running into something that I'm finding rather frustrating and odd.

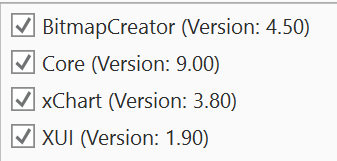
I add xCharts library to the project. I copy over the code from the demo app. Trying to replicate the app (just one of the charts, not all) using JUST the original code and it complains to me that the xchart is not initialized. I see no .initialize command in the demo program so I am somewhat confused as to why I'm seeing this error in what is essentially a clone of the original demo even if it's pared down to only a single chart.
 

kanati

Member
Licensed User
Longtime User
I just did an initialize... Chart1.Initialize("","")

I have no idea if that's supposed to work or not since there's no demo code that would show me what I'm supposed to do there... But now it's throwing an error inside the library itself with a List1 that isn't initialized.

So frustrating the lack of decent documentation and demo code that just WORKS with B4A. Instead of just dealing with logic I seem to spend more time fighting and trying to find ways to make things work.
 
Upvote 0

kanati

Member
Licensed User
Longtime User
Have to also mention that after copying the xml and library files to my libraries directory, now whenever I start B4A I always get an error pop up message telling me there's a missing jar file for xchart.xml. So THAT'S a thing now...
 
Upvote 0

DonManfred

Expert
Licensed User
Longtime User
1. The correct way of adding a customview is to add it to a layout and load this layout.
2. xChart is a b4xlib. You need B4A 8.8+ for them.
If you have an older version you can try to extract the library. Rename xCharts.b4xlib to xCharts.b4xlib.zip, open it with 7zip and extract the class included (the bas file). Add the module to your project, add the customview to your layout and load this layout then.
 
Upvote 0

kanati

Member
Licensed User
Longtime User
I did add it to the layout. BUT I think you have pointed me in the right direction. I didn't name it the same in the code as I did in the layout. Suppose I should have just generated members.

Using 9.00 btw.
 
Upvote 0

DonManfred

Expert
Licensed User
Longtime User
Suppose I should have just generated members.
yes, you should.
Using 9.00 btw.
I dont see a reason for the message you mentioned.
xchart depends on XUI and BitmapCreator. Did you added (downloaded and put to additional libs dir) these libs too?
 
Upvote 0

DonManfred

Expert
Licensed User
Longtime User
Remove the xml from your additional libs folder. Only the b4xlib file should be there i guess

You need to copy the xChart.b4xlib file to the AdditionlLibraries folder for eace product!
No mention to copy the xml file too

I do downloaded the xlib examples and copied the b4xlib to additional libs folder. It works for me. I can open the example and are able to compile without an error.
 
Upvote 0

kanati

Member
Licensed User
Longtime User
That appears to have gotten rid of the error on startup. And while I'm not getting data in the chart, it does appear to be working. (think the chart might be too small for it to replicate the demo).

Thanks for the direction. Definitely further than I've been the last couple of days. I'll pick it up again tomorrow and see what happens.
 
Upvote 0

klaus

Expert
Licensed User
Longtime User
Attached you find a small B4A project with a Line Chart.
The project uses the xChart.b4xlib and the XUI libraries.
The chart is added in the Designer.

The code:

B4X:
Sub Process_Globals
    Private xui As XUI
End Sub

Sub Globals
    Private xChart1 As xChart
End Sub

Sub Activity_Create(FirstTime As Boolean)
    Activity.LoadLayout("Main")
    
    InitChart
End Sub

Private Sub InitChart
    Private x As Int
    'Add two lines to the chart
    xChart1.AddLine("Voltage", xui.Color_Blue)
    xChart1.AddLine("Current", xui.Color_Red)
    
    'Add values to the lines
    'x Mod 10 = 0 means: display the x value only all 10 values
    'x Mod 10 = 0 is True only for 0, 10, 20, 30 etc.
    For x = 0 To 100
        xChart1.AddLineMultiplePoints(x, Array As Double(Rnd(0, 50), Rnd(0, 10)), x Mod 10 = 0)
    Next
    
    'Draw the chart
    xChart1.DrawChart
End Sub

And the result:

upload_2019-4-12_8-36-58.png
 
Upvote 0

kanati

Member
Licensed User
Longtime User
Thanks. That's the best way to do a demo. Boil it down to the bare minimum required to show a result. Can always build from there but sometimes it can be difficult to figure out what you do and do not need with all of the "decoration" code as well. I never got linechart1 to show unless I was dragging my finger across it. Then it would show the tracking line, but never the data. But I did transplant the linechart2 code into a test program and got that working fine. With that and your example here, I should be fine. Thanks again. :)
 
Upvote 0
Top