Android Question Xchart DifferentScales Right Yaxis Scale Shows a Value Half of What it Should be When Set to True

Mahares

Expert
Licensed User
Longtime User
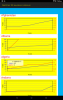
Plotting a Line Chart, when I have Chart.DifferentScales = True and Yaxis Zero set to True both in the Designer, the right Yaxis scale Shows a value half of what it should be. But, when I set Chart.DifferentScales = False ( both Cases and Deaths using the same scale), the Death value matches the scale value. Please see attached image. For instance, for Algeria, the Death value is 4, but the scale value shows 2. I hope someone can see if is an issue worth checking or steer me in the right direction. I use xChart lib version 5.00
Thank you
 

Attachments

  • xChartLine.png
    xChartLine.png
    26.3 KB · Views: 81

klaus

Expert
Licensed User
Longtime User
You spotted another bug in the library.
The problem is NbYIntervals set in the code.
I will update the library soon.
In the mean time set this property in the Designer.
I am used to set the properties in the Designer and not in the code.
I did not test all possible cases, sorry.

When I first looked at your layout I was astonished that you used a an xChart object called 'BarChart2' and the ChartType set to BAR, to draw lines, .
Then I saw that you define the properties in the code.

Thank you for testing :) !
 
Last edited:
Upvote 0
Top