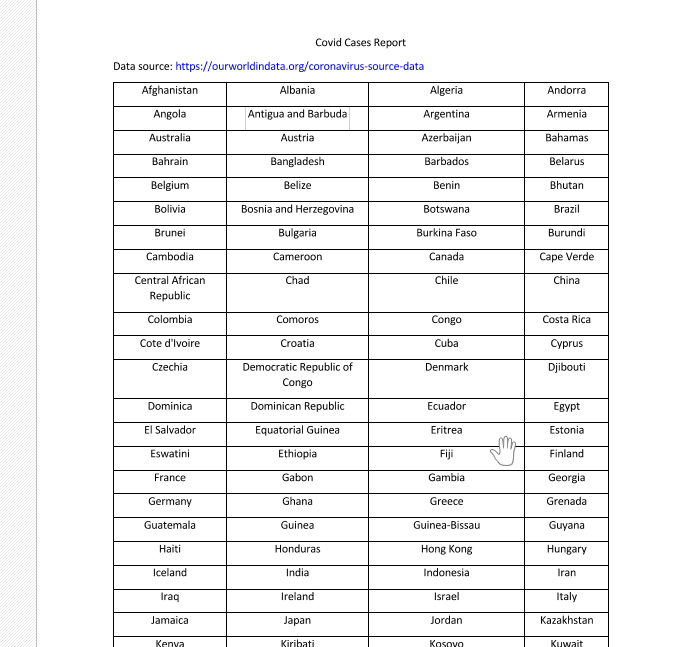
This example visualizes the data from: https://ourworldindata.org/coronavirus-source-data
As the CSV data is quite large, a trimmed dataset is included in the example. The full dataset is available here: https://covid.ourworldindata.org/data/owid-covid-data.csv
It uses Klaus excellent xChart library to draw the chart of each country. A snapshot of the chart is saved and is then added to the Word document.
While it takes some time to draw all charts and prepare the PDF, it shows that XLUtils (POI) can create large Word documents easily.