Android Tutorial Add Charts With Google Charts Service

Status
Not open for further replies.
The attached project is a port of this example: [Server] Google Charts service to Basic4android.
A similar example with more charts is available here: http://www.b4x.com/android/forum/threads/google-charts.31240/#post-186963

upload_2014-3-24_16-7-18.png
upload_2014-3-24_16-7-34.png


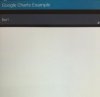
Google Charts is a web service that allows adding all kinds of nice looking and interactive charts. The charts are rendered in Google Charts servers. A WebView is used to show the result. This means that it will not work without an internet connection.

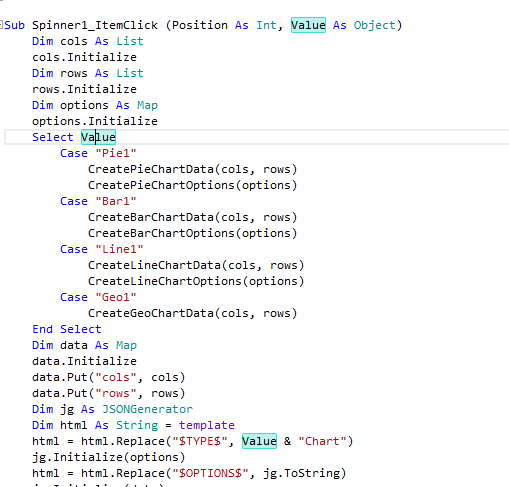
The required html is created with a template file. The data and options JSON strings are added to the template and then loaded to the WebView.

The code is quite simple. Note that the charts will only be displayed on Android 3+ devices.
 

Attachments

  • GoogleCharts.zip
    8.1 KB · Views: 1,968

Jausa

Member
Licensed User
Longtime User
Hi.
I want to know if i can save the result of the Webview to an image or to an static HTML containing the data.
Regards.
 

stanks

Active Member
Licensed User
Longtime User
LineChart question. I want to show different data (3 diff values) for same date in a month (e.g. 1.7. -> 2.10; 1.7 -> 2.5 1.7 -> 2.23 ... 3.7-> 3.01; 3.7. -> 3.02; 3.7. -> 3.4 ...
Landscape only -> X axis days and Y values
How?

thanks
 

stanks

Active Member
Licensed User
Longtime User
i think i solved the problem....which was ...i put for date wrong value and whole chart didn't draw correct
btw Erel can we set all options from
B4X:
https://developers.google.com/chart/interactive/docs/gallery/linechart#Configuration_Options
or not?

thanks
 

stanks

Active Member
Licensed User
Longtime User
i noticed that google charts have problems with values lower then 1.0...will check that more
 

solfinker

Member
Licensed User
Longtime User
Hello.
I have troubles when changing
B4X:
Spinner1.AddAll(Array As String("Bar", "Line", "Pie", "Geo"))
and
B4X:
Select Value
        Case "Pie"
            CreatePieChartData(cols, rows)
            CreatePieChartOptions(options)
        Case "Bar"
            CreateBarChartData(cols, rows)
            CreateBarChartOptions(options)
        Case "Line"
            CreateLineChartData(cols, rows)
            CreateLineChartOptions(options)

into
B4X:
Spinner1.AddAll(Array As String("Bar1", "Line1", "Pie1", "Geo"))
and
B4X:
Select Value
        Case "Pie1"
            CreatePieChartData(cols, rows)
            CreatePieChartOptions(options)
        Case "Bar1"
            CreateBarChartData(cols, rows)
            CreateBarChartOptions(options)
        Case "Line1"
            CreateLineChartData(cols, rows)
            CreateLineChartOptions(options)

which creates no charts at all.

Thanks for your hints
 

solfinker

Member
Licensed User
Longtime User
The correct code is executed, but you get a blank screen with no chart at all, but for "Geo". "Geo" is working fine until I change "Geo" into "Geo1".
The same happens with the rest of them.
 

Attachments

  • chart.jpg
    chart.jpg
    15.1 KB · Views: 794
  • GoogleCharts_1.zip
    9.6 KB · Views: 541

solfinker

Member
Licensed User
Longtime User
Thank you!
B4X:
Select Value
        Case "PieWhatever"
            CreatePieChartData(cols, rows)
            CreatePieChartOptions(options)
            value2 = "Pie"
        Case "BarWhatever"
            CreateBarChartData(cols, rows)
            CreateBarChartOptions(options)
            value2 = "Bar"
B4X:
html = html.Replace("$TYPE$", value2 & "Chart")
 

incendio

Well-Known Member
Licensed User
Longtime User
I read that, but how to pass it to map option?

I have tried
B4X:
Option.put ("title.fontSize",18)
But no avail.
 
Status
Not open for further replies.
Top