As i could not find any ready code to make analysis of the curve\chart\data flow, i have tried to make something. It was discussed here (thanks to all in the thread!)
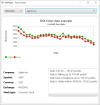
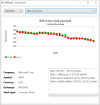
If to have a chart, i mean, the data table with 2 columns, say weather temperature per hour - it would be good to have an analysis code that can check the data changing trend and return some result.
Say, the result may be like "Temperature is rising during 5 hours", or "Warning: sudden freeze for -20 degrees during 5 hours !" ...
This is first my result of such class, tested in B4J mainly, and in B4A. I do not have B4i (i guess, should work as no platform specifics).
The project depends on:


The whole project with the class file is attached.
Any feedback, example of .csv data files, donates are welcome.
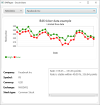
If to have a chart, i mean, the data table with 2 columns, say weather temperature per hour - it would be good to have an analysis code that can check the data changing trend and return some result.
Say, the result may be like "Temperature is rising during 5 hours", or "Warning: sudden freeze for -20 degrees during 5 hours !" ...
This is first my result of such class, tested in B4J mainly, and in B4A. I do not have B4i (i guess, should work as no platform specifics).
The project depends on:
- SQLite lib
- DBUtils code module
- For visual testing: xChart lib
The whole project with the class file is attached.
Any feedback, example of .csv data files, donates are welcome.
v.0.26
Class file v.0.18
Class file v.0.18
Attachments
Last edited: