Current version 1.6
The xGraph Class and B4XLib allows graphic analysis of signals.
It works on all three platforms: B4A, B4i and B4J.
The graph holds a given number of curves (10 by default) with a given number of samples (10000 by default) these values can be defined in the Designer.
All curves have the same number of samples with the same X signal.
What can be done:
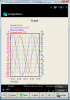
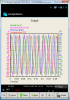
- Draw up to 4 curves on the same graph.
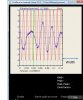
- Show values when moving the cursor on the graph.
- Zooming, either with the cursor or setting in the code.
- Different scale modes.
- Different methods on curves.
-- Copy a curve to another location.
-- Add a value to a curve.
-- Multiply a curve by a value.
-- Add two curves and save the result in another curve.
-- Multiply two curves and save the result in another curve.
-- Calculate the integral of a curve and save the result in another curve.
-- Calculate the derivative of a curve and save the result in another curve.
Attached the xGraphDemo.zip file contains three demo program using the xGraph.b4xlib library,
the xGraph.b4xlib library file, the xGraph.bas file and the xGraph.xml file.
The xGraph library needs the XUI, iXUI, or jXUI libraries.
The xGraphDemo programs need the XUI Views.b4xlib library.
EDIT: Version 1.6 2021.09.11
Amended some bugs
EDIT: Version 1.5 2021.03.19
Amended problem with tooltip label remaining visible.
EDIT: Version 1.4 2021.02.22
Set CurveStrokeWidth to Public
Added CalcRMSValue, RMS calculation of a curve
Added CalcSmooth, smoothing of a curve
Added CalcSmoothExponentialLag and CalcSmoothExponentialLead smouthing methods, kindly provided by rgarnett1955.
Added DrawCurve(Index), draws one curve with the given index
Added DrawCurves(Index()), superimposes up to 4 curves with the given indexes
Added SetGraphToSynchronize method, allows to synchronize two xGraph objects.
Added DeSynchronize method
Added UnZoom method
EDIT: 2020.06.23 Version 1.3
Added GraphWithMissingData and MissingDataValue properties
Updated the Tag property according to Erels recommandation:
 www.b4x.com
Added two cursors with display of the curvevalues.
www.b4x.com
Added two cursors with display of the curvevalues.
Added a Touch event which return
Added a CursorPositionChanged event returning the CursoorIndex and XIndex.
Added these properties XIndexBegin, XIndexEnd. GraphLeft, GraphTop, GraphWidth and GraphHeight
Version 1.2 2020.02.23
Set CurveColor to Public
EDIT: 2019.12.14 Version 1.1
Amended bug reported HERE


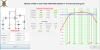
Two synchronized graphs, the upper one zoomed, the bottom one not zoomed.
You see the zoomed part of the upper graph in the bottom one, light greaed.
xGraph
Author: Klaus CHRISTL (klaus)
Version: 1.6
The xGraph Class and B4XLib allows graphic analysis of signals.
It works on all three platforms: B4A, B4i and B4J.
The graph holds a given number of curves (10 by default) with a given number of samples (10000 by default) these values can be defined in the Designer.
All curves have the same number of samples with the same X signal.
What can be done:
- Draw up to 4 curves on the same graph.
- Show values when moving the cursor on the graph.
- Zooming, either with the cursor or setting in the code.
- Different scale modes.
- Different methods on curves.
-- Copy a curve to another location.
-- Add a value to a curve.
-- Multiply a curve by a value.
-- Add two curves and save the result in another curve.
-- Multiply two curves and save the result in another curve.
-- Calculate the integral of a curve and save the result in another curve.
-- Calculate the derivative of a curve and save the result in another curve.
Attached the xGraphDemo.zip file contains three demo program using the xGraph.b4xlib library,
the xGraph.b4xlib library file, the xGraph.bas file and the xGraph.xml file.
The xGraph library needs the XUI, iXUI, or jXUI libraries.
The xGraphDemo programs need the XUI Views.b4xlib library.
EDIT: Version 1.6 2021.09.11
Amended some bugs
EDIT: Version 1.5 2021.03.19
Amended problem with tooltip label remaining visible.
EDIT: Version 1.4 2021.02.22
Set CurveStrokeWidth to Public
Added CalcRMSValue, RMS calculation of a curve
Added CalcSmooth, smoothing of a curve
Added CalcSmoothExponentialLag and CalcSmoothExponentialLead smouthing methods, kindly provided by rgarnett1955.
Added DrawCurve(Index), draws one curve with the given index
Added DrawCurves(Index()), superimposes up to 4 curves with the given indexes
Added SetGraphToSynchronize method, allows to synchronize two xGraph objects.
Added DeSynchronize method
Added UnZoom method
EDIT: 2020.06.23 Version 1.3
Added GraphWithMissingData and MissingDataValue properties
Updated the Tag property according to Erels recommandation:
[B4X] How to get <custom view here> from <CLV or any other container>
This is a common question and for a good reason. Custom views classes are not views by themselves. The views tree only holds views. This means that this code cannot work: Dim B4XFloatTextField1 As B4XFloatTextField = CLV.GetPanel(x).GetView(y) The actual view that is added to the views tree...
www.b4x.com
Added a Touch event which return
Added a CursorPositionChanged event returning the CursoorIndex and XIndex.
Added these properties XIndexBegin, XIndexEnd. GraphLeft, GraphTop, GraphWidth and GraphHeight
Version 1.2 2020.02.23
Set CurveColor to Public
EDIT: 2019.12.14 Version 1.1
Amended bug reported HERE
Two synchronized graphs, the upper one zoomed, the bottom one not zoomed.
You see the zoomed part of the upper graph in the bottom one, light greaed.
xGraph
Author: Klaus CHRISTL (klaus)
Version: 1.6
- xGraph
- Events
- CursorPositionChanged (CursorIndex As Int, XIndex As Int)
- Touch (Parameters() As TouchParameters)
TouchParameters (Action As Int, X As Int, Y As Int, XIndex As Int)
X and Y are screen coordinates.
- Methods:
- AddCursor (Color As Int)
Adds a cursor with the given color by touching the graph - CalcAddValue (CurveIndex As Int, Value As Double, ZoomedPartOnly As Boolean)
Adds a value to the given cuve
ZoomedPartOnly = True calculates only the zoomed part if the curve is zoomed - CalcDerivative (SourceIndex As Int, DestinationIndex As Int, ZoomedPartOnly As Boolean)
Calculates the derivative of the source curve and copies the result in the destination curve
ZoomedPartOnly = True calculates only the zoomed part if the curve is zoomed - CalcDevide2Curves (SourceIndex1 As Int, SourceIndex2 As Int, DestinationIndex As Int, ZoomedPartOnly As Boolean)
Devides two curves and copies the result in the destination curve
Curve(DestinationIndex) = Curve(SourceIndex1) / Curve(SourceIndex2)
ZoomedPartOnly = True calculates only the zoomed part if the curve is zoomed - CalcIntegral (SourceIndex As Int, DestinationIndex As Int, InitilalCondition As Double, ZoomedPartOnly As Boolean)
Calculates the integral of the source curve and copies the result in the destination curve
ZoomedPartOnly = True calculates only the zoomed part if the curve is zoomed - CalcMeanValue (CurveIndex As Int, ZoomedPartOnly As Boolean) As Double
Returns the mean value of the given curve
ZoomedPartOnly = True calculates only the zoomed part if the curve is zoomed - CalcMultiplyByValue (CurveIndex As Int, Value As Double, ZoomedPartOnly As Boolean)
Multiplies the curve by the given value
ZoomedPartOnly = True calculates only the zoomed part if the curve is zoomed - CalcMutiply2Curves (SourceIndex1 As Int, SourceIndex2 As Int, DestinationIndex As Int, ZoomedPartOnly As Boolean)
Multiplies two curves and copies the result in the destination curve
Curve(DestinationIndex) = Curve(SourceIndex1) * Curve(SourceIndex2)
ZoomedPartOnly = True calculates only the zoomed part if the curve is zoomed - CalcRMSValue (CurveIndex As Int, ZoomedPartOnly As Boolean)
Returns the RMS value of the given curve.
ZoomedPartOnly = True calculates only the zoomed part if the curve is zoomed. - CalcSmooth (SourceIndex As Int, DestinationIndex As Int, Span As Int, ZoomedPartOnly As Boolean, SmoothType As String)
Smooths the source curve and saves the result in the destination curve.
The Smooth method takes the mean value of the number of samples given in Span around a sample and saves it at the same index.
Number of samples must be an odd number, if an even number is enterd its value is incremented by 1.
Documentation: https://en.wikipedia.org/wiki/Moving_average.
ZoomedPartOnly = True calculates only the zoomed part if the curve is zoomed.
SmoothType = "MEAN" or "RMS".
Be aware that with RMS smothing, and nagative values, you will get wrong data.
Example code:
xGraph1.CalcSmooth(2, 4, 5, False, "MEAN") - CalcSmoothExponentialLag (SourceIndex As Int, DestinationIndex As Int, Kt As Double, ZoomedPartOnly As Boolean)
Smooths the source curve and saves the result in the destination curve, sort of low pass filter.
The smoothing algorithm is a first order lag which implements an exponential response to a step input Kt must be smaller than 1.0
yd[t] = yd[t-1] + Kt (ys[t] - yd[t-1])
yd = destination ys = source
Documentation: https://en.wikipedia.org/wiki/Exponential_smoothing
Routine kindly provided by rgarnett
Example code:
xGraph1.CalcSmoothExponentialLag(2, 4, 0.5, False) - CalcSmoothExponentialLead (SourceIndex As Int, DestinationIndex As Int, Kt As Double, ZoomedPartOnly As Boolean)
Smooths the source curve and saves the result in the destination curve, sort of high pass filter.
The smoothing algorithm is a first order lead which implements an step response and exponential decay to a step input. Kt must be smaller than 1.0.
yd = Kt (ys[t]- yd[t-1])
ydLast = y[t-1] + yt
yd = destination ys = source.
Routine kindly provided by rgarnett1955.
Example code:
xGraph1.CalcSmoothExponentialLead(2, 4, 0.5, False) - CalcSubtract2Curves (SourceIndex1 As Int, SourceIndex2 As Int, DestinationIndex As Int, ZoomedPartOnly As Boolean)
Substracts two curves and copies the result in the destination curve
Curve(DestinationIndex) = Curve(SourceIndex1) - Curve(SourceIndex2)
ZoomedPartOnly = True calculates only the zoomed part if the curve is zoomed - CalcSum2Curves (SourceIndex1 As Int, SourceIndex2 As Int, DestinationIndex As Int, ZoomedPartOnly As Boolean)
Adds two curves and copies the result in the destination curve
Curve(DestinationIndex) = Curve(SourceIndex1) + Curve(SourceIndex2)
ZoomedPartOnly = True calculates only the zoomed part if the curve is zoomed - CopyCurve (SourceIndex As Int, DestinationIndex As Int)
Copies the curve with SourceIndex to the DestinationIndex curve. - DeSynchronize
Desynchronizes two synchronized xGraph objects. - DrawCurve (Index As Int)
Draws the curve with the given index.
Example code:
xGraph1.DrawCurve(2) - DrawCurves (Indexes() As Int)
Draws the curves with the given indexes.
Example code:
xGraph1.DrawCurves(Array As Int(0,1,2,3)) - DrawGraph
Draws a graph - GetScaleAuto (CurveIndex As Int) As ScaleValues
Gets the automatic scale for the given curve - GetScaleManu (CurveIndex As Int) As ScaleValues
Gets the manual scale for the given curve - Initialize (Callback As Object, EventName As String)
- NumberFormat3 (Number As Double, MaxDigits As Int) As String
Formats numbers with a fixed number of digits and scientific notation - RemoveCursor (Index As Int)
Removes one or both cursors.
Set 0 or 1 as cursor index to delete one cursor.
Set 2 to delete both cursors.
When you remove cursor(0) cursor(1) becomes cursor(0), it is removed from the list.
If there is only one Cursor, then any index value will remove the cursor. - SelectGraph (Selected As Boolean)
Sets the xGraph object to Selected or not.
Selected = True, draws a colored line at the right side.
Selected = False, removes the colored line.
Used when two xGraph objects are synchronized.
Draws a line at the right side of the graph. - SetCursor (XIndex As Int, CursorIndex As Int, Color As Int)
Sets one of the two cursors.
XIndex = sample index, in the curve array.
CursorIndex = 0 or 1, index of the cursor. - SetCurveName (CurveIndex As Int, Name As String, UpdateGraph As Boolean)
Sets the a new name for the curve with the given index
UpdateGraph = True redraws the graph - SetCurveUnit (CurveIndex As Int, Unit As String, UpdateGraph As Boolean)
Sets a new unit for the curve with the given index
UpdateGraph = True redraws the graph - SetGraphToSynchronize (GraphToSynchronize As XGraph, SelectedGraphShow As Boolean, SelectedGraphColor As Int, SynchronizeZoom As Boolean, DisplaySynchronizedZoomArea As Boolean)
If you have two xGraph objects you can synchronize them.
Condition: the X scales must be the same.
Cursors and zoom are active on both objects.
GraphToSynchronize = xGraph object to synchronize.
SelectedGraphShow = True shows a line at the right side of the graph, with the SelectedGraphColor.
SelectedGraphColor = color of the line at the right side of the graph.
SynchronizeZoom = True synchronizes the zoom in both graphs.
= False you can have two different zoom levels in the two graphs.
DisplaySynchronizedZoomArea = True, when one graph is zoomed and the other not, displays the zoomed area in the other graph.
= False, does not display the zoomed area.
Example code:
xGraph1.SetGraphToSynchronize(xGraph2, True, xui.Color_Red, True)
xGraph2.SetGraphToSynchronize(xGraph1, True, xui.Color_Blue, True)
To synchronize two xGraph objects, you need to add the two lines above in your code. - SetSameScale (SameScaleCurveIndex As Int)
Sets the scale of curve SameScaleCurveIndex for all curves - SetScaleManu (CurveIndex As Int, MinVal As Double, MaxVal As Double)
Sets a manual scale for a given curve - SetZoomIndexes (BeginIndex As Int, EndIndex As Int)
Sets the begin and end indexes for zoom diaplay - SetZoomMode
Sets the zooming mode
The user selects with the curor the left limit and then the right limit - UnZoom
- AddCursor (Color As Int)
- Properties:
- AutomaticYScales
Gets or sets the automatic scales mode
True displays automatic Y sacales for all curves
False displays the manual scales - CurvesToDisplay
Gets or sets the curves to display - DisplayCurveIndex
Gets or sets the DisplayCurveIndex property
True displays the curve index before the curve name
Example: 3 : Speed - DisplayCurveUnit
Gets or sets the DisplayCurveUnit property
True displays the curve unit after the curve name
Example: Speed [m/s] - DisplaySynchronizedZoomArea
When two xGraph objects are synchronized and when one graph is zoomed and the other not,
True > displays the zoomed area in the other graph
False > does not display the zoomed area in the other graph. - DrawCursorValues
gets or sets the DrawCursorValues property
Displays the values of the cuves at the cursor position - GraphColor
Gets or sets the graph background color - GraphHeight
Gets the GraphHeight property
The height of the Graph in pixels - GraphLeft
Gets the GraphLeft property
The left position of the Graph in pixels - GraphTop
Gets the GraphTop property
The top position of the Graph in pixels - GraphWidth
Gets the GraphWidth property
The width of the Graph in pixels - GraphWithMissingData
Gets or sets the GraphWithMissingDat property
Manages curves with missing data, it is necessary to enter the MissingDataValue in place. - GridColor
Gets or sets the graph grid color - GridFrameColor
Gets or sets the graph grid frame color - Height
Gets or sets the Height property - Left
Gets or sets the Left property - MissingDataValue
Gets or sets the MissingDataValue property
Used when GraphWithMissingData = True, the missing data must be replaced by this value - NbMaxCurves
Gets or sets the max number of curves - NbMaxSamples
Gets or sets the max number of samples - NbSamples
Gets or sets the current number of samples - NbXIntervals
Gets or sets the number of x axis intervals - NbYIntervals
Gets or sets the number of y axis intervals - NumberOfCursors
Gets the current number of cursors. - OuterFrame
Gets or sets the graph outer frame property
True = draws an outer frame around the graph - OuterFrameColor
Gets or sets the graph outer frame color - ScaleXValues
Gets or sets the ScaleValues property
it is a string with the different scale values separated by an exclamation mark.
it must begin with 1! and end with !10
Example: the default property 1!2!2.5!5!10
These values can be selected in the Designer: 1!2!2.5!5!10|1!1.2!1.5!1.8!2!2.5!3!4!5!6!7!8!9!10 - ScaleYValues
Gets or sets the ScaleValues property
used for automatic scales
it is a string with the different scale values separated by the exclamation mark.
it must begin with 1! and end with !10
Example: the default property 1!2!2.5!5!10
These values can be selected in the Designer: 1!2!2.5!5!10|1!1.2!1.5!1.8!2!2.5!3!4!5!6!7!8!9!10 - Snapshot
Returns a B4XBitmap object of the graph (read only) - SynchronizeZoom
When two xGraph objects are synchronized.
Synchronize the zoom in both graphs. - Title
Gets or sets the graph title - Top
Gets or sets the Top property - UseCustomColors
Gets or sets the UseCustomColors property.
UseCustomColors = False, 4 colors and widths are used for superimpositions they remain the same independant of the curves displayed.
UseCustomColors = True, one specific color and width can be defined for each curve. - Width
Gets or sets the Width property - XAxisName
Gets or sets the x axis name - XAxisUnit
Gets or sets the x axis uni - XIndexBegin
Gets the XIndexBegin property
Index of the first visible item - XIndexEnd
Gets the XIndexBegin property
Index of the last visible item
- AutomaticYScales
- Events
Attachments
Last edited: