ChartsDevice.dll thick line at bottom of chart

RB Smissaert

Well-Known Member
Licensed User
Longtime User
For some reason when I use the ChartsDevice dll (and same on the desktop)
I get a thick line just above the x-axis going from position 0 to about 9 tenth
of the x-axis. I noticed the provided example (the line chart) does the same and I have no idea how to get rid of it.
Any ideas?

RBS
 

RB Smissaert

Well-Known Member
Licensed User
Longtime User
I attached a .gif file that shows what I am talking about.
The line in this image runs till the 9 in the second date.

RBS
 

Attachments

  • LineDemo.jpg
    LineDemo.jpg
    15.1 KB · Views: 203

RB Smissaert

Well-Known Member
Licensed User
Longtime User
This code shows it with me:
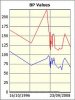
Sub DrawLineChart

LineChart.New1(Image1.Width, Image1.Height)
LineChart.Text = "BP values"
LineChart.Color = Rgb(255,255,230)
LineChart.ColorGradient = cBlue
LineChart.GridSpacingValue = 20
LineChart.MaxScaleValue = 180
LineChart.MinScaleValue = 80
LineChart.ShowGrid = False
LineChart.BorderSize = 10
LineChart.MarginForTextOnAxis = 10

LineChart.XAxisIntervalValue = 1
LineChart.AddXAxisText(240,240, "")

LineChart.NewLine(cRed)
LineChart.AddPoint(0, 160)
LineChart.AddPoint(1, 150)
LineChart.AddPoint(2, 155)
LineChart.AddPoint(3, 170)
LineChart.AddPoint(4, 180)
LineChart.AddPoint(5, 150)
LineChart.AddPoint(6, 140)
linechart.ShowGrid = True
LineChart.AddLine

LineChart.NewLine(cBlue)
LineChart.AddPoint(0, 90)
LineChart.AddPoint(1, 85)
LineChart.AddPoint(2, 90)
LineChart.AddPoint(3, 100)
LineChart.AddPoint(4, 110)
LineChart.AddPoint(5, 80)
LineChart.AddPoint(6, 140)
LineChart.AddLine

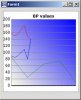
LineChart.NewLine(cGreen)
LineChart.LineWidth = 1
LineChart.AddPoint(0, 85)
LineChart.AddPoint(5, 25)
LineChart.AddPoint(10, 65)
LineChart.AddPoint(15, 75)
LineChart.AddPoint(20, 10)
LineChart.AddTrendLine

Image1.Image =LineChart.Draw

End Sub


RBS
 

klaus

Expert
Licensed User
Longtime User
I have looked at your code.
The code you posted doesn't match your image, why didn't you post the right code?

The problem lies in the line
B4X:
[FONT=Courier New][SIZE=2][FONT=Courier New][SIZE=2]LineChart.AddXAxisText([/SIZE][/FONT][/SIZE][/FONT][FONT=Courier New][SIZE=2][COLOR=#800080][FONT=Courier New][SIZE=2][COLOR=#800080][FONT=Courier New][SIZE=2][COLOR=#800080]240[/COLOR][/SIZE][/FONT][/COLOR][/SIZE][/FONT][/COLOR][/SIZE][/FONT][FONT=Courier New][SIZE=2][FONT=Courier New][SIZE=2],[/SIZE][/FONT][/SIZE][/FONT][FONT=Courier New][SIZE=2][COLOR=#800080][FONT=Courier New][SIZE=2][COLOR=#800080][FONT=Courier New][SIZE=2][COLOR=#800080]240[/COLOR][/SIZE][/FONT][/COLOR][/SIZE][/FONT][/COLOR][/SIZE][/FONT][FONT=Courier New][SIZE=2][FONT=Courier New][SIZE=2], [/SIZE][/FONT][/SIZE][/FONT][FONT=Courier New][SIZE=2][COLOR=#800000][FONT=Courier New][SIZE=2][COLOR=#800000][FONT=Courier New][SIZE=2][COLOR=#800000]""[/COLOR][/SIZE][/FONT][/COLOR][/SIZE][/FONT][/COLOR][/SIZE][/FONT][FONT=Courier New][SIZE=2][FONT=Courier New][SIZE=2])[/SIZE][/FONT][/SIZE][/FONT]

if you replae it by
B4X:
[FONT=Courier New][SIZE=2][FONT=Courier New][SIZE=2]LineChart.AddXAxisText([/SIZE][/FONT][/SIZE][/FONT][FONT=Courier New][SIZE=2][COLOR=#800080][FONT=Courier New][SIZE=2][COLOR=#800080][FONT=Courier New][SIZE=2][COLOR=#800080]0[/COLOR][/SIZE][/FONT][/COLOR][/SIZE][/FONT][/COLOR][/SIZE][/FONT][FONT=Courier New][SIZE=2][FONT=Courier New][SIZE=2],[/SIZE][/FONT][/SIZE][/FONT][FONT=Courier New][SIZE=2][COLOR=#800080][FONT=Courier New][SIZE=2][COLOR=#800080][FONT=Courier New][SIZE=2][COLOR=#800080]20[/COLOR][/SIZE][/FONT][/COLOR][/SIZE][/FONT][/COLOR][/SIZE][/FONT][FONT=Courier New][SIZE=2][FONT=Courier New][SIZE=2], [/SIZE][/FONT][/SIZE][/FONT][FONT=Courier New][SIZE=2][COLOR=#800000][FONT=Courier New][SIZE=2][COLOR=#800000][FONT=Courier New][SIZE=2][COLOR=#800000]""[/COLOR][/SIZE][/FONT][/COLOR][/SIZE][/FONT][/COLOR][/SIZE][/FONT][FONT=Courier New][SIZE=2][FONT=Courier New][SIZE=2])[/SIZE][/FONT][/SIZE][/FONT]

you get a 'normal' X axis.

With you code the program tries to draw no text at position 240.

Attached 2 images.


@agraham
In trying this example I noticed that the parameter MinScaleValue with posutive values has no effect.

B4X:
[FONT=Courier New][SIZE=2][FONT=Courier New][SIZE=2]LineChart.MinScaleValue=[/SIZE][/FONT][/SIZE][/FONT][FONT=Courier New][SIZE=2][COLOR=#800080][FONT=Courier New][SIZE=2][COLOR=#800080][FONT=Courier New][SIZE=2][COLOR=#800080]20[/COLOR][/SIZE][/FONT][/COLOR][/SIZE][/FONT][/COLOR][/SIZE][/FONT]

Best regards.
 

Attachments

  • Chart_240_240..jpg
    Chart_240_240..jpg
    18.7 KB · Views: 198
  • Chart_0_20.jpg
    Chart_0_20.jpg
    20 KB · Views: 187
Last edited:

agraham

Expert
Licensed User
Longtime User
There are two problems here :(

First this statment "LineChart.XAxisIntervalValue = 1" puts the X-axis ticks too close together for a maximum scale value of 240 so they run into each other as a grey bar.

Second, why then does the grey bar not extend to the end? The answer is that there is a bug in drawing the ticks when the max value of the X axis (which is determined by the max value defined in the AddXAxisText statements) is greater than the number of display pixels along the the X-axis. If you need a larger value than this the solution is to scale the X values to be less than that number of pixels.

@Klaus
In trying this example I noticed that the parameter MinScaleValue with posutive values has no effect.
That is correct. MinScaleValue is intended for extending the Y value range into negative values. If it is greater than 0 it has no effect.
 

klaus

Expert
Licensed User
Longtime User
In my mind I would have expected, that if I had a chart with values between 80 and 100 and setting the MinScaleValue to 80 and MaxScaleValue to 100, getting a diagram with a streched Y scale from 80 to 100.

Unfortunately this seems not beeing the case.

Best regards.
 

RB Smissaert

Well-Known Member
Licensed User
Longtime User
> The code you posted doesn't match your image, why didn't you post the right code?

The code that produced the image I posted is a lot more complex and I would have to simplify it a lot. The code I posted is simple and shows the problem.
Will look at Graham's post now.

RBS
 

RB Smissaert

Well-Known Member
Licensed User
Longtime User
> First this statment "LineChart.XAxisIntervalValue = 1" puts the X-axis ticks too close together for a maximum scale value of 240 so they run into each other as a grey bar.

Yes, thanks that was the problem and I can simply do:
LineChart.XAxisIntervalValue = 240

As Klaus mentioned, it would be nice if you could make:
LineChart.MinScaleValue =
respond to positive values, so setting a positive lowest value for the Y-axis.


RBS
 
Top