Hello,
(this is not a full tutorial, just a overview of this 2 tools)
I wrote my first animation in a app and with no idea what im doing i was running poorly...
While debugging i struggled with writing Log messages to get an idea whats going on, so i searched around and found this 2 tools here.
Firebase, a online test suite: https://console.firebase.google.com/
Android GPU Inspector, tests on your own hardware: https://developer.android.com/agi
On Firebase you upload the apk or aab and select from a pool of virtual and real devices. Then it runs a "Robo" test where it clicks around and you get a report from it.
This is how i started, the animation "kicks in" at 1 minute:

Can you see it? The memory is bouncing around, i constantly created and destroyed objects...
And this is after a change to only modify the objects:

Memory is about stable and the CPU is lower and not jumping around, also for the user this is smoother to watch!
Firebase gives way more than this graph, a full screen video from the test, screenshots, logfile and more are given.
So with this i was already quite happy, but then the Android GPU Inspector!
Besides its name, it does not only GPU, it does everything...
For this i used a Samsung S10 wired to a PC hit record while the animation was running:
This is with the object modification, so good memory usage:
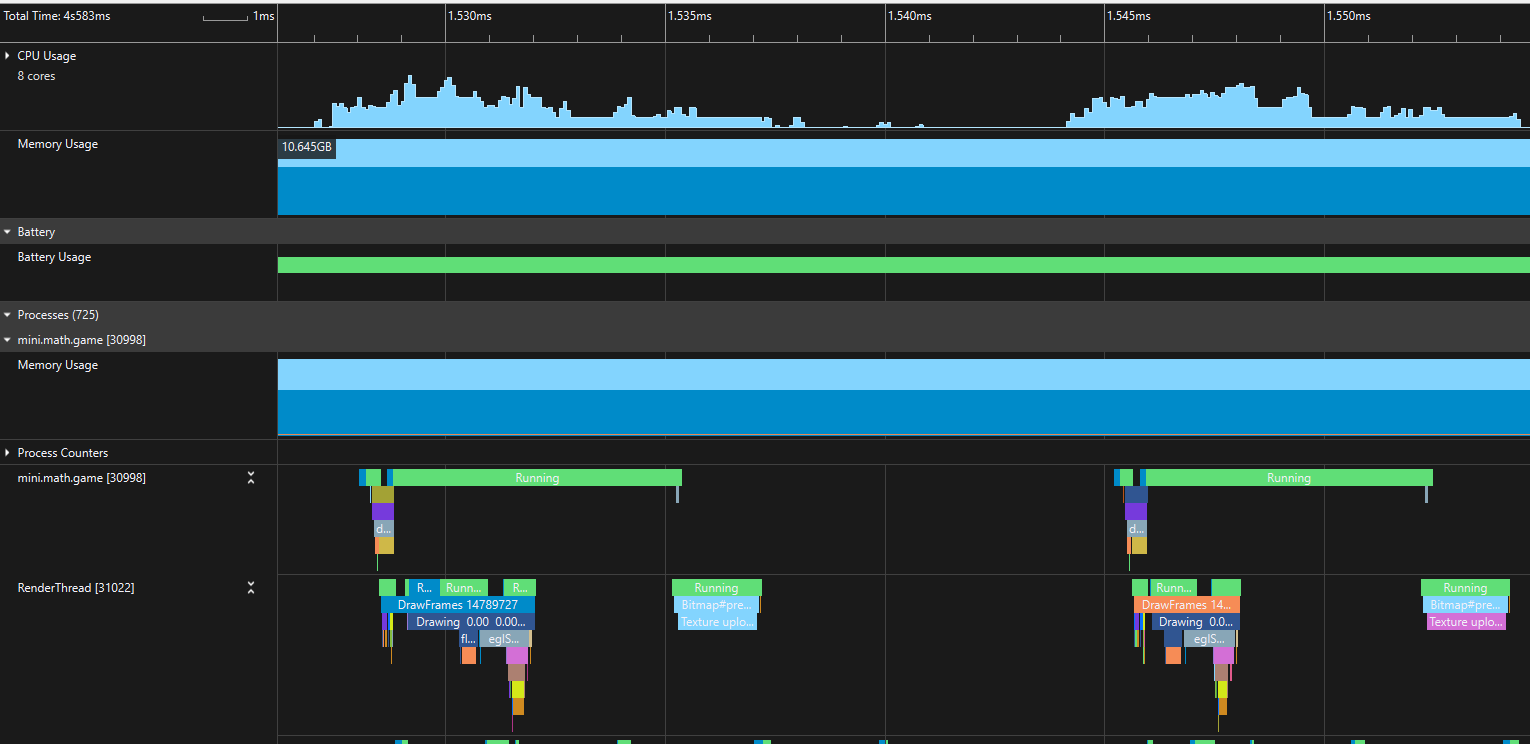
This is zoomed into 2 drawing cycles, the space between them is about the length of the drawing itself, not much left for slower hardware and a gap in the render:

After shuffling code around, quite some google for particle generation:

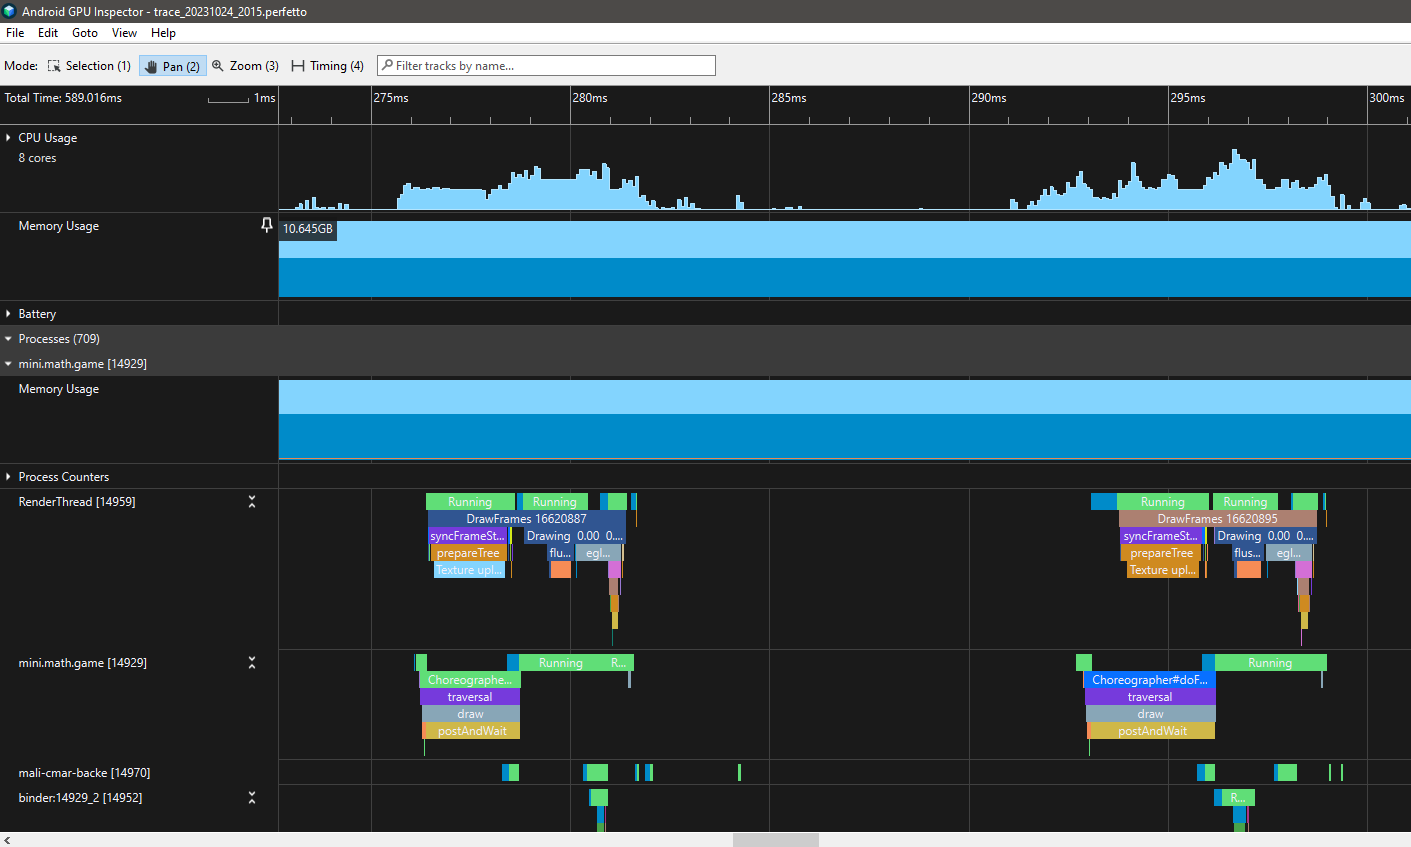
Now there is quite some empty space in between the drawing cycles, and no more gap in the render, im happy!
So if you have some performance issues, or are just curious how your (or other) apps perform, give this tools a try
Or do you know other tools like this?
(this is not a full tutorial, just a overview of this 2 tools)
I wrote my first animation in a app and with no idea what im doing i was running poorly...
While debugging i struggled with writing Log messages to get an idea whats going on, so i searched around and found this 2 tools here.
Firebase, a online test suite: https://console.firebase.google.com/
Android GPU Inspector, tests on your own hardware: https://developer.android.com/agi
On Firebase you upload the apk or aab and select from a pool of virtual and real devices. Then it runs a "Robo" test where it clicks around and you get a report from it.
This is how i started, the animation "kicks in" at 1 minute:
Can you see it? The memory is bouncing around, i constantly created and destroyed objects...
And this is after a change to only modify the objects:
Memory is about stable and the CPU is lower and not jumping around, also for the user this is smoother to watch!
Firebase gives way more than this graph, a full screen video from the test, screenshots, logfile and more are given.
So with this i was already quite happy, but then the Android GPU Inspector!
Besides its name, it does not only GPU, it does everything...
For this i used a Samsung S10 wired to a PC hit record while the animation was running:
This is with the object modification, so good memory usage:
This is zoomed into 2 drawing cycles, the space between them is about the length of the drawing itself, not much left for slower hardware and a gap in the render:
After shuffling code around, quite some google for particle generation:
Now there is quite some empty space in between the drawing cycles, and no more gap in the render, im happy!
So if you have some performance issues, or are just curious how your (or other) apps perform, give this tools a try
Or do you know other tools like this?
