This example shows how you can draw a googles chart on a webview. The code uses a two classes to do so. The code is quite simple and straightforwad. As you pass some properties to the class to generate the class.
Types of charts available:
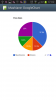
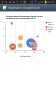
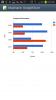
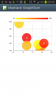
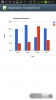
The examples uses are similar to the Google Charts Development website. There are also a few charts to add herein. See the images for more details and the source code has all the examples via the menu.
Types of charts available:
- Pie and 3D Pie chart
- Donut
- Map (markers not displaying??)
- Motion Chart (not displaying yet??)
- Bubble chart
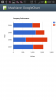
- Bar Chart
- Stacked Bar
- Gauge
- Column Chart
- Stacked Column
- Combination Chart
- Line Chart
- Area Chart
- Organizational Chart
- Geo Chart - Regions
- Geo Chart - Markers
- Table
- Table - Arrow Format
- Table - Bar Format
- Table - Number Format
- Timelines
The examples uses are similar to the Google Charts Development website. There are also a few charts to add herein. See the images for more details and the source code has all the examples via the menu.
Attachments
-
 Screenshot_2013-07-26-17-03-32.png60.9 KB · Views: 9,837
 -
 Screenshot_2013-07-26-17-13-38.png79.1 KB · Views: 1,885
 -
 Screenshot_2013-07-27-00-10-06.png93.2 KB · Views: 1,684
 -
 Screenshot_2013-07-27-00-10-29.png58.3 KB · Views: 1,670
 -
 Screenshot_2013-07-27-00-10-46.png55 KB · Views: 1,545
 -
 Screenshot_2013-07-27-00-10-51.png53.7 KB · Views: 1,567
 -
 Screenshot_2013-07-27-00-59-33.png73.5 KB · Views: 1,614
 -
 Screenshot_2013-07-27-01-22-22.png63.7 KB · Views: 1,859
 -
mashiane_googlecharts.zip23.9 KB · Views: 1,762
Last edited: