B4A Library Google Charts

This library will allow you to create nice charts using the Google Charts API.

Requirements:

1- B4A 4.3x.

2- The CloudPrint library.

3- The WebViewExtras library.

4- Internet connection.

5- Copy the GoogleCharts.xml and GoogleCharts.jar to your additional libraries directory.


Usage:
B4X:
'Initialize the library
Private gChart As GoogleCharts

gChart.Initialize(ChartView, Me, "Chart", True)

gChart.AddOnlineCustomFontToChart = "Roboto:100" 'The font name is CASE SENSITIVE.

gChart.PieChartTitle = "My daily activities (hours)"
gChart.PieChartTitleStyle("purple", "roboto", 30, False, True)
gChart.PieChartLegend("right", "blue", "roboto", 20, False, False)
gChart.PieChart3D = True
gChart.PieChartSliceText = "percentage"
gChart.PieChartSliceLabelAndValue("Work", 11)
gChart.PieChartSliceLabelAndValue("Eat", 2)

gChart.PieChartSliceLabelAndValue("Commute", 2)
gChart.PieChartSliceLabelAndValue("Watch TV", 2)
gChart.PieChartSliceLabelAndValue("Sleep", 7)
gChart.PieChartSetSliceOffset("Watch TV", 3)


gChart.ShowPieChart

The charts included are:

- Pie (3D and Donut).
- Bar.
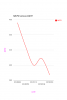
- Combo (Bar, Area, Stepped Area, Line).
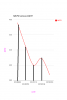
- Histogram.
- Scatter.
- Bubble.
- Geo.


Features:

- Use custom fonts (Online fonts via Google Fonts or local).
- Save charts.
- Print charts.


For more details about the use of this library please check the attached project.

You can try the attached APK if you just want to see what the library can do.
 

Attachments

  • GoogleCharts_Lib_1.0.zip
    23 KB · Views: 502
  • GoogleChartsSampleProject.zip
    61.6 KB · Views: 494
  • GoogleChartsSample.apk
    214.9 KB · Views: 407

Mahares

Expert
Licensed User
Longtime User
I wanted to draw a line graph representing data extracted from a SQlite able like this DATE (horizontal axis) and MCFD vertical axis:
DATE MCFD
20140423 456
20140703 425
20141113 400
20150106 409
20150318 387

I could not find an option for a line graph so I tried to modify the Combo option. My problem is : I could not find a way to include the DATE field in the horizontal axis..
Here is the code:
B4X:
Sub Combo
                gChart.Initialize(ChartView, Me, "Chart", True)           
                gChart.AddOnlineCustomFontToChart = "Roboto:300"
                gChart.ComboChartTitle = "MCFD versus DATE"
                gChart.ComboChartTitleStyle("blue", "roboto", 20, False, True)
                gChart.ComboChartLegend("right", "red", "verdana", 14, False, False)   
                gChart.ComboChartSetColumnLabel = "MCFD"
                Private comboColorsList As List
                Private comboSeriesColor As List   
                comboColorsList.Initialize
                comboSeriesColor.Initialize
           
                Dim lstMCFD As List
                lstMCFD.Initialize
                For i=0 To Cursor1.RowCount-1
                         Cursor1.Position=i
                                lstMCFD.Add(Cursor1.GetString("AVMCFD"))
                Next
       
                comboColorsList.AddAll(Array As String("red", "magenta"))
                comboSeriesColor.AddAll(Array As String("#5C3292"))
           
                gChart.ComboChartSetColumnValues("?????", lstMCFD) 'HERE IS THE PROBLEM
           
                gChart.ComboChartOrientation = "horizontal"
                gChart.ComboChartDefaultCurveType = "function"
                gChart.ComboChartSetDefaultSeriesType = "line"

                gChart.ComboChartCreateSeries("MCFD", "line", "function", True)
                gChart.ComboChartCrosshair("both", "both")
   
                gChart.ComboChartSetAxisTitlesPosition = "out"
                gChart.ComboChartSetHorizontalAxisTitle("DATE", "magenta", "verdana", 14, False, True)
                gChart.ComboChartSetVerticalAxisTitle("MCFD", "magenta", "verdana", 14, False, True)
                gChart.ComboChartSeriesColor = comboSeriesColor
           
                gChart.ShowComboChart

End Sub
Thank you for helping
 

NJDude

Expert
Licensed User
Longtime User
That would be something like:
B4X:
gChart.ComboChartSetColumnValues("20140423", lstMCFD) 

...

You only have 1 column, so you'll have only the Label and 1 value, to better understand, you can play around with the sample code I attached on the 1st post. It might take a little bit of getting used to but is not difficult.
 

Mahares

Expert
Licensed User
Longtime User
gChart.ComboChartSetColumnValues("20140423", lstMCFD)
I played around with your sample for quite some time. The dates change. How can your suggestion work NJDude. Each value in the MCFD column must correspond to a given value in the DATE field that changes. The problem is : How do you extract the dates from the DATE field that is in the table. You can't possibly have this:
B4X:
Dim lstMCFD As List
lstMCFD.Initialize
For i=0 To Cursor1.RowCount-1
       Cursor1.Position=i
       lstMCFD.Add(Cursor1.GetString("AVMCFD"))
Next
for i= 0 to Cursor1.Rowcount -1
   gChart.ComboChartSetColumnValues(cursor1.getstring("DATE"), lstMCFD)
next
 

NJDude

Expert
Licensed User
Longtime User
You will have to get all the dates (e.g. 20140423, 20140703, etc) and add them to an array or list, then all the values, after that add them to the chart, in other words, is not a one shot deal, you will have to gather the data first before you add it to the chart.
 

Mahares

Expert
Licensed User
Longtime User
@NJDude: It is great what you do for the forum. Please allow me to make a couple of observations:
1. Iterating through all the records and initializing the list every record may cause the chart to load very slowly particularly if the table has hundreds of records to plot.
2. I can see vertical grid lines but not horizontal grid lines.
3. I attempted to save the chart of course by initializing the chart=true, but all it saves is the word 'Hidden'
4. Also when printed, it just prints the word 'Hidden' which is the content of the file saved. Google cloud lib is installed.
If you have any comments on the above, please set me straight. It is Friday, going to a fish fry. I will be close to the confessional.
Thank you
 

NJDude

Expert
Licensed User
Longtime User
@NJDude: It is great what you do for the forum. Please allow me to make a couple of observations:
1. Iterating through all the records and initializing the list every record may cause the chart to load very slowly particularly if the table has hundreds of records to plot.
That's normal, and due to the way the API works, which incidentally is meant to be used on desktops, but even on desktops, it might take a little bit of time to render.
2. I can see vertical grid lines but not horizontal grid lines.
I'm not sure what you mean by that, all the charts show horizontal grid lines.
3. I attempted to save the chart of course by initializing the chart=true, but all it saves is the word 'Hidden'
I'm puzzled, setting TRUE on the initialization will show a MENU button, and on the attached sample I demonstrated how to save a chart, no idea what that "hidden" is all about, would you please give me more details?
4. Also when printed, it just prints the word 'Hidden' which is the content of the file saved. Google cloud lib is installed.
The printing part is nothing but the printed representation of what was saved, so, if something weird was saved something weird will be printed.
 

Mahares

Expert
Licensed User
Longtime User
I'm not sure what you mean by that, all the charts show horizontal grid lines.
Sorry, I meant: I see horizontal gridlines, but not vertical gridlines.

I'm puzzled, setting TRUE on the initialization will show a MENU button, and on the attached sample I demonstrated how to save a chart, no idea what that "hidden" is all about, would you please give me more details?
The same thing happened with your original example on your first post. I get the 'hidden' word I really do not know. It is weird. I even changed the extension to jpg and it did not make a difference. For your information, I have been using Machiane's GoogleCharts class for quite some time and it works very well and quite fast even for a large number of points plotted. But, I wanted to give your library a try because everything you do is always pragmatic and simplified. Machiane's class does not have the saving and printing capabilities.
Thank you
 

Mahares

Expert
Licensed User
Longtime User
I think it might have something to do with OS 5.0. I use the Samsung S5 phone with OS 5.0. The word hidden actually appears as soon as I press the 'Menu' button before I even save or print the file. I even downloaded your sample again and the same odd thing happened. However, I installed the app on a tablet with OS4.2.2 and the graph saved as it is supposed to and looked good.

On another issue, did you have a chance to look into Google line chart when you created your library without associating it with the COMBO chart. It might be simpler to implement. The reason I used your COMBO chart is because it was the only one that allowed me to mimic a line chart.
Thank you for your expertise
 

Peter Simpson

Expert
Licensed User
Longtime User
@Mahares there are no vertical lines only horizontal in @NJDude's screen shot above. Can you point to a particular chart or reply with a screen shot as I'm completely baffles too. Most charts (not all) only use horizontal lines. I presume that you're talking about the horizontal background value lines.

I've tested this library on devices running Android 4.4.2, 5.0.1, 5.0.2 and 5.1 with no issues whatsoever.
 

Mahares

Expert
Licensed User
Longtime User
Most charts (not all) only use horizontal lines.
It would have been nice if the graph generated by NJDude's lib displays vertical gridlines that intersect the X value axis. It would add better readability for the chart. See the chart that is generated by the lib and the other chart where I manually added the vertical gridlines.
 

Attachments

  • SavedChart.png
    SavedChart.png
    24 KB · Views: 307
  • SavedChart_With_VerticalGridlines.png
    SavedChart_With_VerticalGridlines.png
    23.6 KB · Views: 290

Mahares

Expert
Licensed User
Longtime User
I don't t think that's possible in Google Charts.
Take a look at the below link, Google line chart displays vertical and horizontal gridlines. The rest of us have been accustomed to challenge someone like you to figure it out because of your vast knowledge. We have been spoiled with powerhouses like you. With or without offering that option, your lib is still very useful and deserves great accolade.
https://developers.google.com/chart/interactive/docs/gallery/linechart
 
Top