Graph settings

gkumar

Active Member
Licensed User
Longtime User
I have to display a graph with multiple curves.
I saw the Graph sample application. I could not understood what is amplitude, offset and omega parameters.
I have around 200 X and Y points. Is it not possible to direct curve point value assigment without above parameters?

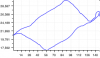
I want a similar kind of graph look as in attached image.
Please let me know the best possible settings for this.
 

Attachments

  • graph.png
    graph.png
    7.7 KB · Views: 307

gkumar

Active Member
Licensed User
Longtime User
Thanks Erel, I could able to use the Refector now.
Thanks Claus, the graph line looks smooth now after filtering.
 
Upvote 0

gkumar

Active Member
Licensed User
Longtime User
For the X and Y scales I am displaying the values like by rounding it to the nearest integer. For example 15760 etc. values.
While displaying in the graph scales I wanted to display it by appending commas for every 3rd digit.
For example if I have value 15760, in the graph it should display as 15,760 (inserting a ',' in between). 15760 is the string converted from number to display in the graph.
Is there any format methods to format like this?
 
Upvote 0

Mahares

Expert
Licensed User
Longtime User
Did you try this function:
B4X:
Dim strN As String   :strN="15760"
Msgbox(NumberFormat2(strN,0,0,0,True),"")   'returns 15,760
 
Upvote 0

gkumar

Active Member
Licensed User
Longtime User
Scroll inside a graph grid view

Hi,

I am able to display the graph now with all the required things. Thanks for the help to all.

But now I need another thing. I need to draw a graph and grid with scroll option only inside the grid area, like when I hold to a point on grid area, I should be able to scroll the graph in all the directions. other area, views outside the grid should be in fixed position like that.

Thanks,
 
Last edited:
Upvote 0
Top