Hello Erel
First of all thanks for the code in your graphs example (esp. the line graph). In fact I have had some good use.
I have tried to understand the codes where the graphs and grids are actually created and I am no wiser. I want to display my "dynamic & real time" curve similar to Klaus' oscilloscope example.
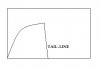
I could do it with your approach except that there is always a "tailing line" that links the end of the plotted curve to the the x-axis (ie y = 0 when there is no data yet). Please refer to my attachment.
Is there something in the code that can be tweaked to make the "tailing-line" transparent?
Thank you.
First of all thanks for the code in your graphs example (esp. the line graph). In fact I have had some good use.
I have tried to understand the codes where the graphs and grids are actually created and I am no wiser. I want to display my "dynamic & real time" curve similar to Klaus' oscilloscope example.
I could do it with your approach except that there is always a "tailing line" that links the end of the plotted curve to the the x-axis (ie y = 0 when there is no data yet). Please refer to my attachment.
Is there something in the code that can be tweaked to make the "tailing-line" transparent?
Thank you.