Share My Creation Scroll Chart Example

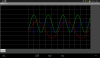
I started with the Klaus Oscilloscope example, and modified as a strip chart recorder. Only one Panel and Canvas were used. It is very basic, just to check the method.

I am new to graphics and B4A. If you see improvements, or suggestions please comment. I wish to learn from others.
 

Attachments

  • Screenshot_2013-02-13-10-07-45.png
    Screenshot_2013-02-13-10-07-45.png
    25.2 KB · Views: 7,922
  • ScrlChrt.zip
    6.9 KB · Views: 1,099

Thuong

Member
Licensed User
Longtime User
Dear KitCarlson
I like your simple scroll Plot V1.0, then I try it but I have a question for you:
1/ I had ready data string in list, and I would like add this data to your code
2/ How to change Y max of sroll plot
Can you help me
Thank
 

KitCarlson

Active Member
Licensed User
Longtime User
1/ The data in the list would be entered in GetValues. The example uses sine calculations, replace that with list data.
2/ The Ymax can stay the same, but .Scale and .Offset are used to fit data to plot area.

It may be helpful to make small changes to my example as a learning process. Change the sine calculation to something different.
The timer advances the X axis, in a real application the incoming data is handled then. While the example does 100 points, just let the data roll.
 

Thuong

Member
Licensed User
Longtime User
Dear KitCarlson
I would like increase to 5000 points and how to change code of ScrlChrt
Pls help me
Thank
 

KitCarlson

Active Member
Licensed User
Longtime User
I am not sure how to answer your question. 5000 points is more than than the number of screen pixels. The scroll chart will display the data and oldest data rolls off. A datalog could be used, and a means to pan the data on screen.
 
Top