Hi all,
I would like to code a spectrogram app to dispaly FFT of audio file.
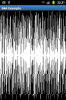
The result would be something like this :

The image is coming from the right to to the left, one column at a time when a new FFT is performed on the audio stream. Vertical axis dispays the amplitude of the FFT for each frequency.
Currently the FFT is OK, audio stream as well.
But I do have a very stupid question : I don't know how to perform the scrolling...
It seems easy to paint into a canvas the new right most column
But what is the best solution to clip the image (but the first column) and to shift it one pixel to the left ?
Thank you for your help
I would like to code a spectrogram app to dispaly FFT of audio file.
The result would be something like this :
The image is coming from the right to to the left, one column at a time when a new FFT is performed on the audio stream. Vertical axis dispays the amplitude of the FFT for each frequency.
Currently the FFT is OK, audio stream as well.
But I do have a very stupid question : I don't know how to perform the scrolling...
It seems easy to paint into a canvas the new right most column
But what is the best solution to clip the image (but the first column) and to shift it one pixel to the left ?
Thank you for your help