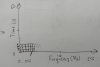
It is required to display the traveling signal in time. The x-axis is the frequency (0..256 Hz). The y-axis is the time (0..60sec). Color to display the amplitude (from blue to red). Each new row (256 values) shifts the previous top (for one second). How can i do this? Any advice ...
-
Welcome to B4X forum!
B4X is a set of simple and powerful cross platform RAD tools:
- B4A (free) - Android development
- B4J (free) - Desktop and Server development
- B4i - iOS development
- B4R (free) - Arduino, ESP8266 and ESP32 development
You are using an out of date browser. It may not display this or other websites correctly.
You should upgrade or use an alternative browser.
You should upgrade or use an alternative browser.
B4J Question Signal spectrum
- Thread starter red30
- Start date
- Similar Threads Similar Threads
There are several options for charts drawings: https://www.b4x.com/android/forum/pages/results/?query=charts
You can redraw the complete chart every second.
You can redraw the complete chart every second.
Upvote
0
Thank you Erel! I searched, but did not find anything that would suit my task. I understand how to fill one line with 256 values, but I do not understand how to move it higher by one position and fill the bottom line again. Can anyone have an example that will help me figure it out?
Something like this

Something like this
Last edited:
Upvote
0
Can you please give some more detailed explanations:
- Where do the data come from?
- Are there always 256 elements?
- How are their colors defined?
- What does the Frequency scale mean?
Do you already have a project with the data collecting?
- Where do the data come from?
- Are there always 256 elements?
- How are their colors defined?
- What does the Frequency scale mean?
Do you already have a project with the data collecting?
Last edited:
Upvote
0
Attached you find a small test project moving the rows and drawing a new row with 256 random colors every second.

B4X:
Sub Activity_Create(FirstTime As Boolean)
    Activity.LoadLayout("Main")

    cvsGraph.Initialize(pnlGraph)

    InitGraph

    Timer1.Initialize("Timer1", 1000)
    Timer1.Enabled = True

    DrawRow
End Sub

Sub Activity_Resume

End Sub

Sub Activity_Pause (UserClosed As Boolean)

End Sub

Private Sub InitGraph
    dx = (pnlGraph.Width - 40dip) / 256
    x0 = (pnlGraph.Width - 256 * dx) / 1.8
    x1 = x0 + 256 * dx
    dy = (pnlGraph.Height - 40dip) / 60
    y0 = pnlGraph.Height - (pnlGraph.Height - 60 * dy) / 1.8
    y1 = y0 - 60 * dy
    cvsGraph.DrawLine(x0 - 4dip, y0, x1 + 6dip , y0, Colors.Black, 1dip)
    cvsGraph.DrawLine(x0, y0 + 4dip, x0 , y1 - 6dip, Colors.Black, 1dip)
    rectMoveSource.Initialize(x0, y0 - 59 * dy, x1, y0)
    rectMoveDest.Initialize(x0, y1, x1, y0 - dy)
End Sub

Private Sub DrawRow
    Private col, x, y As Int
    Private rct As Rect

    For col = 0 To 255
        x = x0 + col * dx
        y = y0 - dy
        rct.Initialize(x, y, x + dx, y0)
        cvsGraph.DrawRect(rct, Colors.RGB(Rnd(0, 256), Rnd(0, 256), Rnd(0, 256)), True, 1dip)
    Next
    pnlGraph.Invalidate
End Sub

Private Sub MoveRows
    cvsGraph.DrawBitmap(cvsGraph.Bitmap, rectMoveSource, rectMoveDest)
End Sub

Private Sub Timer1_Tick
    MoveRows
    DrawRow
End Sub
Attachments
Upvote
0
Can you please give some more detailed explanations in the forum:
- Where do the data come from?
- Are there always 256 elements?
- How are their colors defined?
- What does the Frequency scale mean?
Do you already have project with the ata collecting?
Well, I will try. The Array of data (256 byte) come to me by usb interface. Yes, there are always 256 bytes. Each byte has amplitude of signal from 0x00 to 0xFF. I want to display it with the color from purple to red (from 0x00 to 0xff). One package of 256 bytes is one row along the x-axis. Package comeone time in a second. Next package (in a second) must move the previous (color row) one row up, and so on to 60th. When 61st comes - the top is removed. And so in the cycle. I hope everything is clear, if there are any questions, please contact. Thank you very much for your help !!!
Attachments
Upvote
0
Thank you very much, I will look at your project, then i ll write the result!
As for colors, I am thinking, but the idea is as follows:
1 byte: 0x00..0xff
0x00..0x2a-purple
0x2b..0x54-blue
0x55..0x7e-light blue
0x7f..0xa8-green
0xa9..0xd2-yellow
0xd3..0xff-red
And there must be soft change between colors.
As for colors, I am thinking, but the idea is as follows:
1 byte: 0x00..0xff
0x00..0x2a-purple
0x2b..0x54-blue
0x55..0x7e-light blue
0x7f..0xa8-green
0xa9..0xd2-yellow
0xd3..0xff-red
And there must be soft change between colors.
Upvote
0


In general, if you are interested in the full task:
According to the USB, I receive 512 samples of 2 bytes each (1024 bytes) every 125 milliseconds.
Then you need to make an FFT, and get a spectrum of 256 points by 2 bytes and display with one row (the color of each count will be responsible for the amplitude).
And so the cycle is shifted upward by one row.
Upvote
0
Attached you find the B4J version.
My thanks go to Daesturm and sorex who guided me in the right direction.
My thanks go to Daesturm and sorex who guided me in the right direction.
Attachments
Upvote
0
I did not understand the question ...Thank you, now I understand the whole project.
What kind of signal are you getting from USB?
I'm getting a signal from the sensor 512 samples (2 bytes).
Thank you, on Android it works.The layout file format has changed since 6.31.
Attached a project for B4A version 6.31.
Works under Windows! Thank you!
Upvote
0
What kind of physical signal or what kind of sensor?I'm getting a signal from the sensor 512 samples (2 bytes).
No, now it's easy.And it will be difficult to alter to work on Windows?
Look at post#17.
Upvote
0
Sincerely, the kind of signal doesnt matter. The sampling frequency is 512 Hz.What kind of physical signal or what kind of sensor?
You can try to generate a random signal of 512 samples by 2 bytes and try to work with it ...
Last edited:
Upvote
0