Android Tutorial Android Charts Framework

Status
Not open for further replies.
The purpose of this framework is to allow you to easily add different types of charts to your projects.
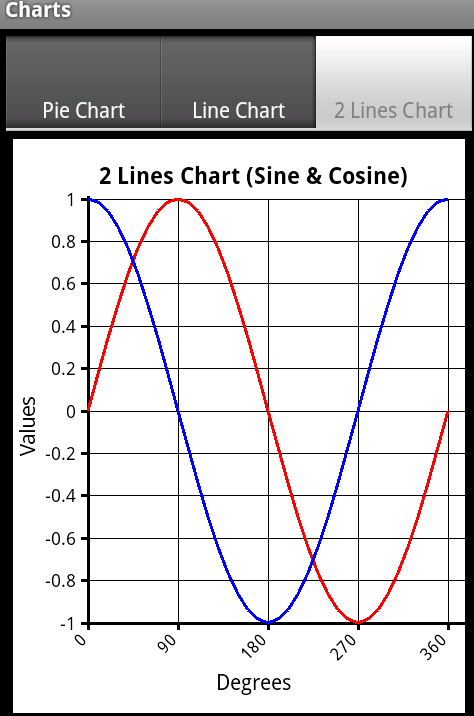
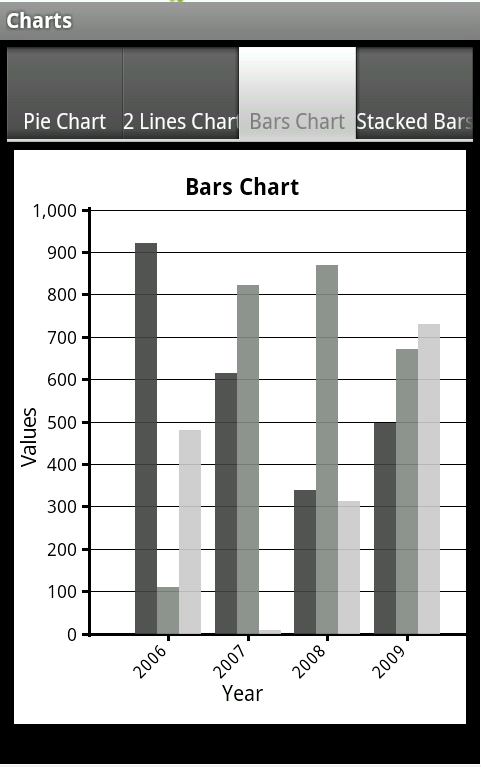
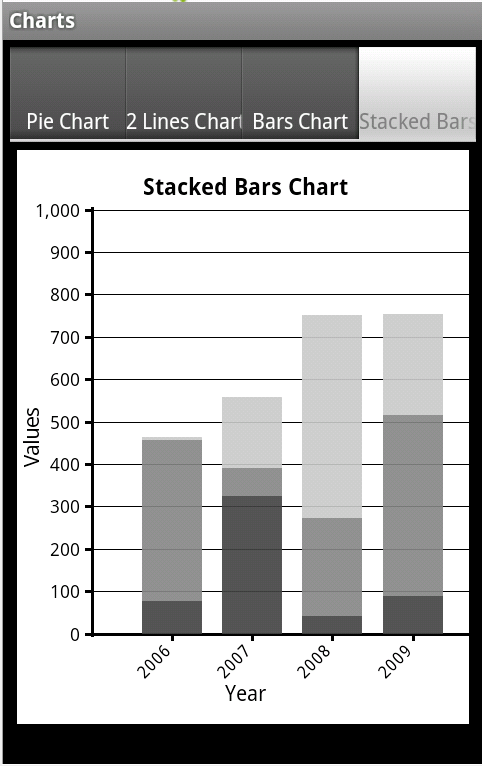
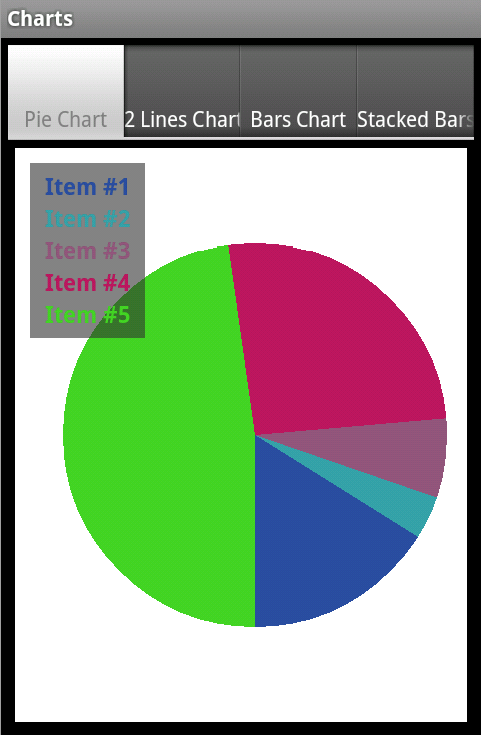
The current version supports pie charts, line charts and bar charts.

The framework is implemented as code modules. You are free to customize the code as needed.

I also recommend you to go over the code. It demonstrates several concepts including: usage of custom types, drawings, string measurements and region clipping.


charts_2.png

charts_bars.png

charts_stackedbars.png


charts_pie.png


The code module is attached as part of the example project.
Questions, comments and suggestions are welcomed.

Klaus has posted a version that includes automatic scaling: http://www.b4x.com/android/forum/threads/android-charts-framework.8260/page-7#post-240181
 

Attachments

  • Charts.zip
    9.6 KB · Views: 7,622
Last edited:

chrjak

Active Member
Licensed User
Longtime User
oh dear. i don't understand you. Maybe you can try to explain in german? because you are from switzerland!?
 

klaus

Expert
Licensed User
Longtime User
Du kannst die untere Linie auf den Unterpunktwert setzen und die obere Linie auf den Hochpunktwert setzen.
Und dann die Zwischenlinien je nach Anzahl der Linien anpassen.
Die Skalawerte sind dann leider alles Andere als 'normalisiert'.
Es ist möglich eine Skalierungsroutine zu schreiben aber in diesem Fall müsste auch die Distanz zwischen Diagramrand und Gitterrand angepasst werden weil die Zahlen grössere Längenunterschiede haben können.
 

chrjak

Active Member
Licensed User
Longtime User
Danke Klaus.
Ich habe aber nur eine Linie. Unterpunkt und Hochpunkt sind nur die höchsten und niedrigsten Werte dieser Linie.
Grüße
 

klaus

Expert
Licensed User
Longtime User
Als Linien meinte Ich die Linien des Diagrammgitters, nicht die Datenlinie denn es geht doch um die Skalierung.
Da hast Du eine unterste Linie, eine oberste Linie und Zwischenlinien für die Skalierung.
Hast Du ein konkretes Beispiel oder besser ein Projekt das Du posten könntest mit einer Erklärung was Du genau erwartest ?

Kannst Du die weiteren Fragen im Deutschen Forum posten weil wir hier im Englischen Forum sind.
 

klaus

Expert
Licensed User
Longtime User
Have a look at the attached test project with automatic scaling.
The scales are in 1, 2, 2.5 and 5 standardized values like in an oscilloscope.
The scale is the same for all curves.
In the test program click on the screen to generate a new diagram.
Three curves are generated with random gains.
On top you can select automatic scaling or 'manuel' predefined scaling.
 

Attachments

  • LinesAutoScaleChart1.png
    LinesAutoScaleChart1.png
    29.6 KB · Views: 1,177
  • LinesAutoScaleChart2.png
    LinesAutoScaleChart2.png
    29.5 KB · Views: 1,060
  • LinesAutoScaleChart.zip
    10.9 KB · Views: 1,349

fishwolf

Well-Known Member
Licensed User
Longtime User
is it possible add a line legend on line charts ?
i have found the ItemPieItem, but not for line charts

B4X:
Dim LD As LineData
Dim G As Graph

    pnl2Lines.Initialize("pnlStackedBars")
    Activity.AddView(pnl2Lines, 1%x, 42dip, 99%x, Activity.Height - 42dip - 50dip)

    LD.Initialize
    LD.Target = pnl2Lines
    Charts.AddLineColor(LD, Colors.Red) 'First line color
    Charts.AddLineColor(LD, Colors.Blue) 'Second line color
    
    Charts.AddLineMultiplePoints(LD, i, Array As Float(3.0, 2.6), False)
    Charts.AddLineMultiplePoints(LD, i, Array As Float(3.1, 3.0), False)
    Charts.AddLineMultiplePoints(LD, i, Array As Float(3.2, 1.7), False)
    Charts.AddLineMultiplePoints(LD, i, Array As Float(3.3, 2.4), False)
    Charts.AddLineMultiplePoints(LD, i, Array As Float(3.4, 2.3), False)
    Charts.AddLineMultiplePoints(LD, i, Array As Float(3.5, 2.0), False)
    Charts.AddLineMultiplePoints(LD, i, Array As Float(3.6, 2.7), False)
   
    G.Initialize
    G.Title = "Grafico velocità"
    G.XAxis = "gare"
    G.YAxis = "m/s"
   
    G.YStart = 0
    G.YEnd = 5
    G.YInterval = 0.5
   
    G.AxisColor = Colors.Black
    Charts.DrawLineChart(G, LD, Colors.White)
 

GMan

Well-Known Member
Licensed User
Longtime User
Running the sampleworks fine, but if i added the Charts.bas to my project and given the missing parts in my MAIN, the code throws always an error when trying to get the fontsize.
i.e. here:
B4X:
BD.Canvas.DrawText(Text, x1 - 2dip, y1 + 4dip, Typeface.DEFAULT, Main.FontSize - 3, Color, "RIGHT")

unknown member fontsize

but Fontsize is defined in process globals in Main - so why is there an error ?

Uncommenting this let it run (without text ;-)):
B4X:
'    Case "LEFT"
'        BD.Canvas.DrawText(Text, x1 - 2dip, y1 + 4dip, Typeface.DEFAULT, Main.FontSize - 3, Color, "RIGHT")
'    Case "LEFTUP"
'        BD.Canvas.DrawText(Text, x1 + 2dip, y1 - 2dip, Typeface.DEFAULT, Main.FontSize - 3, Color, "LEFT")
'    Case "CENTERUP"
'        BD.Canvas.DrawText(Text, (x1 + x2) / 2, y1 - 2dip, Typeface.DEFAULT, Main.FontSize - 3, Color, "CENTER")
'    Case "RIGHT"
'        BD.Canvas.DrawText(Text, x2 + 2dip, y1 + 4dip, Typeface.DEFAULT, Main.FontSize - 3, Color, "LEFT")
 

GMan

Well-Known Member
Licensed User
Longtime User
Fontsize is 12
the error at least as written:
unknow member: fontsize, then the codeline and at last: Word: fontsize

i dont see logs, so i cant see whats going up. only the MsgBox with that error

I added the module as usual over the IDE and declared Fontsize as written.
 

GMan

Well-Known Member
Licensed User
Longtime User
And (the Gretchenfrage): how can i fill in datas read from a Table list (or csv) ?

Here are sample datas i have:

30.05.2014 07:45 some datas
30.05.2014 09:31 some datas
30.05.2014 12:14 some datas
30.05.2014 18:12 some datas
31.05.2014 06:08 some datas
31.05.2014 10:29 some datas
31.05.2014 11:17 some datas
01.06.2014 07:28 some datas
01.06.2014 09:11 some datas

Aim is to create a bar chart with the date and the amounts of measurements, so in the example 30.05. = 4, 31.05. = 3 etc. with your Scalable Chart .
 

klaus

Expert
Licensed User
Longtime User
i dont see logs, so i cant see whats going up. only the MsgBox with that error
Why don't you see logs ?
Without seeing what exactly you have done and how impossible to help you.
how can i fill in datas read from a Table list (or csv) ?
What do you mean with Table list and what with csv ?
- Reading from a csv file it's up to you to read the csv file and fill the values for the chart depending on what data you want to show.
- With Table list, where does your data come from, what do you want to diplay ?
It's up to you to get the data and fill the charts according to these data.

About the FontSize problem, could you post a small project showing the problem, otherwise impossible to know what happens.
 

yuhong

Member
Licensed User
Longtime User
Share(thanks for Erel's help):

1.Setting the antialias flag of the canvas.

2.Remove the clipping and use DrawArc instead for pie chart(need ABExtDrawings library).

Make Line charts and Pie charts show more smoothly( boundaries).

Charts moudle add two subs.
 

Attachments

  • Charts.zip
    458.8 KB · Views: 654

GMan

Well-Known Member
Licensed User
Longtime User
@yuhong :
thx for sharing - the bar chart part is interesting for me.
So how can i fill i datas to create a chart with daily values (for each day).

See here how my data file looks like:
30.05.2014 07:45 some datas
30.05.2014 09:31 some datas
30.05.2014 12:14 some datas
30.05.2014 18:12 some datas
31.05.2014 06:08 some datas
31.05.2014 10:29 some datas
31.05.2014 11:17 some datas
01.06.2014 07:28 some datas
01.06.2014 09:11 some datas
So i want to display a data bar for each day with the added amount of values, i.e.
30.05.14 4
31.05.14 3
01.06.14 2

The depending part is here:
B4X:
For i = 1 To 4
        Charts.AddBarPoint(BD, 2005 + i, Array As Float(Rnd(0, 1000), Rnd(0, 1000), Rnd(0, 1000)))
Next

@klaus :
sorry, missed your post.
i cant see logs of my devices 'cause i am using Vista 64bit (we had a discussion about that in another thread some time ago).
the log only shows when it is connected, but no other datas (even a Log("Test") not).

Funny: from an old 2.1 Tablet (my actual Smartphone has 4.2.2) all datas are received

Same devices, 32bit System - all devices send? / the IDE receives? all datas
 

klaus

Expert
Licensed User
Longtime User
Did you have a look at chapter 9.3.3.2 Bar Chart in the User's Guide ?

In your example with:
30.05.14 4
31.05.14 3
01.06.14 2
You need to supply always the max number of values per day and set to 0 the missing ones.
B4X:
Charts.AddBarPoint(BD, "30.05.14", Array As Float(Value1, Value2, Value3, Value4))
Charts.AddBarPoint(BD, "31.05.14", Array As Float(Value1, Value2, Value3, 0))
Charts.AddBarPoint(BD, "01.06.14", Array As Float(Value1, Value2, 0, 0))
When you have less values, there will be 0 bars taking the place horizontaly.

Perhaps you might consider the StackedBarChart.
 

GMan

Well-Known Member
Licensed User
Longtime User
Thx for your answer - but the amount of data entries varies from day to day, means it can be 2, but it can be also 11 or 18
so how can i get those Valuex-parameter as needed ?

i thought about
- reading the date values and increment a counter variable
- if a new data appears, the previous "collected" variable is set to the previous date
- ...and start again with Zero by finding this other date

etc.

So, in my head is all clear but...enough knowledge is missing
 

klaus

Expert
Licensed User
Longtime User
The current Charts Framework doesn't allow to have a different number of data per dataset.

How do you want to display the data ?

As already suggested you could use the StackedBarChart, set the none existing values to 0, so nothing will be displayed.
With side by side bars it's not possible.
 

GMan

Well-Known Member
Licensed User
Longtime User
i want to display them as a single bar for each day, the bar should only show the amount
 
Status
Not open for further replies.
Top