B4A Library FFT Fast Fourier transform library

A new B4X FFT library does exits, the library in this thread is only valid for B4A.

The ownership of this post has been changed by Erel from agraham to klaus, with agrahams agreement, to allow me to edit this post with the update of the FFT library.

agrahams original text.
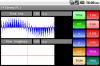
About nine months ago Klaus and I collaborated on a Basic4ppc library and demonstration program to perform forward and inverse Fast Fourier Transforms.

We have collaborated once again to port the library and demo to Basic4android.


Update 2014.08.03
The library has been updated after the bug report here.
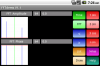
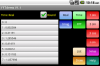
The demo program has been 'rewritten' to take advantage of the B4A improvements since december 2010.
 

Attachments

  • FFT_lib_V1_2.zip
    4.7 KB · Views: 891
  • FFTDemoV1_2.zip
    25 KB · Views: 812
  • Time1.png
    Time1.png
    51.7 KB · Views: 1,099
  • FFT1.png
    FFT1.png
    47.4 KB · Views: 995
  • List.png
    List.png
    72.8 KB · Views: 929
Last edited:

maso1975

Member
Licensed User
Longtime User
Now that you mention it I'm not sure, I have made a modification to the code to add the Thread.Start, but I get the same results.
B4X:
Sub Button1_Click
   
    AR.Initialize(AudioSource,SampleRate,ChannelConfig,AudioFormat,BufferSize)
    AR.StartRecording
    StartTime = DateTime.Now
    Record.Start(Record,"FreqDetect",Null)

'    FreqDetect
End Sub
 

Attachments

  • FreqDetect.zip
    454.7 KB · Views: 276

klaus

Expert
Licensed User
Longtime User
Attached you find a small test project.
It is based on your FreqDetect program.
I had never used the AudioRecord library, so I had to learn and it took some time.
In the attached program you can :
- Record record a sound with the mic, it shows the time signal.
- Calc calculate a theroretical 'sound', I needed this to make sure that the time signal is well known and the peak detector works.
- Time display the time signal
- FFT display the frequency signal
- Moving the finger on the diplay shows a cursor and displays the values.
- The first Spinner holds the peaks found.
- The second Spinner allows to change the threashold for peak detection.

The display doesn't show all the time and frequency samples but only the first which fit into the display.
The red vertical line shows the cursor position.
The red horizontal line shows the threashold level.

The signal in the display is just wistling.

The problems in your code were:
- You converted Bytes into Doubles, but the sample size is 2 Bytes so Shorts.
- Buffersize too small, you read only 4096 samples.
 

Attachments

  • FFT_Freq_Detect1.png
    FFT_Freq_Detect1.png
    41.4 KB · Views: 434
  • FFT_Freq_Detect2.png
    FFT_Freq_Detect2.png
    27.9 KB · Views: 384
  • FFT_Freq_Detect.zip
    14.6 KB · Views: 347
Last edited:

maso1975

Member
Licensed User
Longtime User
Hi Klaus, thank you for your help, and I'm sure other users will thank also, seemed easier than it is, I'll experiment a bit with his example.


Regards, and thanks again for your time.
 

T0mee

Member
Licensed User
Longtime User
I got an array containing values received from my heart-rate-sensor. It contains the time measured between every heart beat (i.e. 700 - 1100 [ms]). Now I would like to calculate the LF (< 0,15 hz) and the HF (> 0,15 hz - 0,4 hz) of the spectrum
...can anybody help me out ?
 

T0mee

Member
Licensed User
Longtime User
Could you post a sample file ?
And I'll have a look at it.
Not sur if the FFT library is of any help here.

I used File.WriteList to create the file ...it contains 400 of the time spaces between my heart-beats.
 

Attachments

  • Intervals.txt
    1.6 KB · Views: 228

T0mee

Member
Licensed User
Longtime User
I attached a screenshot of the results calculated by Kubios (a HRV Software) ...i used the 400 intervals from the 'Intervals.txt'-file.
 

Attachments

  • Intervals.jpg
    Intervals.jpg
    302.7 KB · Views: 344

klaus

Expert
Licensed User
Longtime User
Well,
You say:
It contains the time measured between every heart beat (i.e. 700 - 1100 [ms]).
- What exactly do the values in the file represent ?
The time between the beats ?
Or some other value with a given time interval between the values ?

If the signal is a time signal, with a constant time interval between samples, the FFT could be used, otherwise it is more a statistics probelm.
 

klaus

Expert
Licensed User
Longtime User
Below you see a screenshot on what I get til now.
The top diagram shows the rate intervals, the data from your file.
The middle diagram shows the heart rates.
The botton diagram shows the FFT of the rate intervals.
This is an attempt to generate diagrams similar to the ones in your post.
The FFT doesn't look exactly like in your screenshot, but is relatively close, and I don't know either how the LF and HF values are extracted from the FFT.
Do you have any information on how the FFT is calculated and how to define LF and HF ?
Attached you find the test program in its current stage.
 

Attachments

  • Screenshot.png
    Screenshot.png
    18.1 KB · Views: 347
  • HeartRate.zip
    13.7 KB · Views: 253

T0mee

Member
Licensed User
Longtime User
Hello Klaus,
thank you very much for helping me. I am really happy about this result! Unfortunately, I got no information how the FFT is calculated or how the LF/HF values are extracted - and I can't find more information in the internet.
All I got is the 'Analysis Options' you have seen in the Kubios-Screenshot and this part of a publication:

The spectral components were obtained by harmonic Fourier analysis in the 0.0033–0.5 Hz frequency range, with the power reflecting the square of the amplitudes (Luczak and Laurig, 1973). LF and HF power were calculated by integrating the spectra over the 0.04–0.15 Hz and 0.15–0.40 Hz ranges, respectively (Bigger et al., 1992), and corrected for the square of the mean heart rate (Baharav et al., 1995). Thus, the resulting power was unitless.

I want the software to calculate the LF/HF ratio to get more (+better) information about the vns and stress. Again, thank you very much for your help! I could not have done this...
If I am right, I can now take the output of your test-program and integrate the values to calculate the LF/HF ratio.
 

klaus

Expert
Licensed User
Longtime User
If I am right, I can now take the output of your test-program and integrate the values to calculate the LF/HF ratio.
I think so.
In FFTAmpl you have the amplitudes
and with i / NbSamples * RateMean you get the x axis unit.
 

PhilipK

Member
Licensed User
Longtime User
Hi,

I am in the process of implementing your fantastic FFT routine.

I'm passing an array of data which is a stream of single values (as doubles) called DataFFT

Successive streams are of different lengths (by design).

So when the DataFFT max array index is an odd number, I adjust the index to (index-1) and then divide by 2 to get and set the array size for FFTReal and FFTImag. OK?

On execution, I'm getting an error on the line: FFT.Transform2(DataFFT, FFTReal, FFTImag)

"FFT: Real and Imaginary arrays are incorrect length!'

Any ideas?
Many thanks.
 

PhilipK

Member
Licensed User
Longtime User
Klaus

AAArrrgh, so ridiculously obvious it's embarrassing! I was thinking it was more complex..... Wood and Trees come to mind.

I won't be getting any stars for that!!!

As usual, many thanks,

PhilipK
 

freedom2000

Well-Known Member
Licensed User
Longtime User
Attached you find a small test project.
It is based on your FreqDetect program.
I had never used the AudioRecord library, so I had to learn and it took some time.
In the attached program you can :
- Record record a sound with the mic, it shows the time signal.
- Calc calculate a theroretical 'sound', I needed this to make sure that the time signal is well known and the peak detector works.
- Time display the time signal
- FFT display the frequency signal
- Moving the finger on the diplay shows a cursor and displays the values.
- The first Spinner holds the peaks found.
- The second Spinner allows to change the threashold for peak detection.

The display doesn't show all the time and frequency samples but only the first which fit into the display.
The red vertical line shows the cursor position.
The red horizontal line shows the threashold level.

The signal in the display is just wistling.

The problems in your code were:
- You converted Bytes into Doubles, but the sample size is 2 Bytes so Shorts.
- Buffersize too small, you read only 4096 samples.
HI Klaus,

I am looking for the audiorecord library.
I found one here https://www.b4x.com/android/forum/threads/audiorecord-library.13993/#content

But it is not working with your code (not the same arguments)

Please could you tell me which is the right one ?

Thanks
 

klaus

Expert
Licensed User
Longtime User
Not in a near future.
I will look to make a Class, no time schedule, I don't have the knowledge to write libraries.

Just to be clear, the library was written by Andrew Graham (agraham).
I made a small change in the library, and as Andrew is now less active in the forum Erel changed the ownership of the first post from agraham to mine (with Andrews agreement) to let me update the first post.
I wrote the demo program.
 
Top