B4J Question Firebase notofication stops to work (2)

marcick

Well-Known Member
Licensed User
Longtime User
Again I have problems with Firebase notifications.
I have a JRDC server application on three identical server and the problem appears only on one of them.
The JRDC contains code for managing websockets and also the code for sending notification (copied from the Erel SendTool).
After some times (actually happens every couple of days) the JRDC server seems to works (websocket side) but stop to send notification.
This is the error I grabbed when sending notification:

B4X:
java.net.SocketException: No buffer space available (maximum connections reached?): connect
    at java.net.DualStackPlainSocketImpl.connect0(Native Method)
    at java.net.DualStackPlainSocketImpl.socketConnect(DualStackPlainSocketImpl.java:83)
    at java.net.AbstractPlainSocketImpl.doConnect(AbstractPlainSocketImpl.java:350)
    at java.net.AbstractPlainSocketImpl.connectToAddress(AbstractPlainSocketImpl.java:206)
    at java.net.AbstractPlainSocketImpl.connect(AbstractPlainSocketImpl.java:188)
    at java.net.PlainSocketImpl.connect(PlainSocketImpl.java:172)
    at java.net.SocksSocketImpl.connect(SocksSocketImpl.java:392)
    at java.net.Socket.connect(Socket.java:589)
    at okhttp3.internal.platform.Platform.connectSocket(Platform.java:124)
    at okhttp3.internal.connection.RealConnection.connectSocket(RealConnection.java:187)
    at okhttp3.internal.connection.RealConnection.buildConnection(RealConnection.java:173)
    at okhttp3.internal.connection.RealConnection.connect(RealConnection.java:114)
    at okhttp3.internal.connection.StreamAllocation.findConnection(StreamAllocation.java:196)
    at okhttp3.internal.connection.StreamAllocation.findHealthyConnection(StreamAllocation.java:132)
    at okhttp3.internal.connection.StreamAllocation.newStream(StreamAllocation.java:101)
    at okhttp3.internal.connection.ConnectInterceptor.intercept(ConnectInterceptor.java:42)
    at okhttp3.internal.http.RealInterceptorChain.proceed(RealInterceptorChain.java:92)
    at okhttp3.internal.http.RealInterceptorChain.proceed(RealInterceptorChain.java:67)
    at okhttp3.internal.cache.CacheInterceptor.intercept(CacheInterceptor.java:93)
    at okhttp3.internal.http.RealInterceptorChain.proceed(RealInterceptorChain.java:92)
    at okhttp3.internal.http.RealInterceptorChain.proceed(RealInterceptorChain.java:67)
    at okhttp3.internal.http.BridgeInterceptor.intercept(BridgeInterceptor.java:93)
    at okhttp3.internal.http.RealInterceptorChain.proceed(RealInterceptorChain.java:92)
    at okhttp3.internal.http.RetryAndFollowUpInterceptor.intercept(RetryAndFollowUpInterceptor.java:120)
    at okhttp3.internal.http.RealInterceptorChain.proceed(RealInterceptorChain.java:92)
    at okhttp3.internal.http.RealInterceptorChain.proceed(RealInterceptorChain.java:67)
    at okhttp3.RealCall.getResponseWithInterceptorChain(RealCall.java:179)
    at okhttp3.RealCall.execute(RealCall.java:63)
    at anywheresoftware.b4h.okhttp.OkHttpClientWrapper.executeWithTimeout(OkHttpClientWrapper.java:156)
    at anywheresoftware.b4h.okhttp.OkHttpClientWrapper.access$0(OkHttpClientWrapper.java:153)
    at anywheresoftware.b4h.okhttp.OkHttpClientWrapper$ExecuteHelper.run(OkHttpClientWrapper.java:201)
    at java.util.concurrent.Executors$RunnableAdapter.call(Executors.java:511)
    at java.util.concurrent.FutureTask.run(FutureTask.java:266)
    at java.util.concurrent.ThreadPoolExecutor.runWorker(ThreadPoolExecutor.java:1149)
    at java.util.concurrent.ThreadPoolExecutor$Worker.run(ThreadPoolExecutor.java:624)
    at java.lang.Thread.run(Thread.java:748)

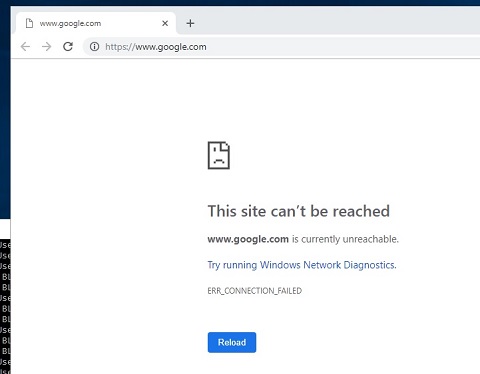
When I'm in this situation, if I open Google Chrome it says there is no connection (but it's not true because I'm connected to the server with remote desktop).

If I close the JRDC application and launch it again, it doesn't work correctly, it stops after the first debug lines and hangs. I must restart the computer to solve.
Any idea ?
Nuova immagine bitmap.jpg
 

marcick

Well-Known Member
Licensed User
Longtime User
Sorry for the confusion in terms: yes, I use ServerSockets listening for connections on a TCP port, and WebSocket for connections with B4I and B4A apps.
Yes, it is open to the internet, but as I wrote above (edit) I already have a counter and it does not increase out of control.
 
Upvote 0

OliverA

Expert
Licensed User
Longtime User
Now you just have to wait and see what happens. If possible, log the counter to a file and keep an eye on it. When the server fails, the counter can help you determine if sockets may or may not be the issue.
 
Upvote 0

marcick

Well-Known Member
Licensed User
Longtime User
Hello. This night happened again the fault and this is the situation:

  1. My JRDC app continues to work without problems. It opens WebSockets and receive data from the devices.
  2. Calling http://xx.xx.xx.xx:17179/test from outside world works ok.
  3. All the JRDC operations with database called from outside world works ok.
  4. The WebSocket counter doesn't report problems (at this moment there is only 1 socket opened)
  5. If I open Google Chrome or IE I get the message "The page can't be reached" as if there is no internet connection (but it's not true, I'm also connected to the server via Remote Desktop).
  6. If I open the Erel sending tool for notification with B4J and launch in debug mode, the program doesn't start, it stops with "Waiting for debugger to connect". If I run in release, it starts and crash with the message I posted above "ResponseError. Reason: java.net.SocketException: No buffer space available (maximum connections reached?)".
  7. If I close the JRDC app and launch it again, It doesn't start: only the firsts 10 log rows or so are showed, then It hangs with an error (something like loopback failed, sorry I failed to capture the log before reboot).
  8. The only solution is to reboot the server.
 
Upvote 0

OliverA

Expert
Licensed User
Longtime User
Look at the Event Viewer and see the errors that pertain to this issue. Maybe you can detect a pattern. You have the windows firewall turned on, correct? And only the port(s) to your application(s) are open to the outside world?
 
Upvote 0

marcick

Well-Known Member
Licensed User
Longtime User
This night notifications stopped at about 02 am and around that hour there is a System Waring in the event viewer:

B4X:
Log Name:      System
Source:        Tcpip
Date:          15/02/2019 02:20:29
Event ID:      4231
Task Category: None
Level:         Warning
Keywords:      Classic
User:          N/A
Computer:      GIGPSWEB
Description:
A request to allocate an ephemeral port number from the global TCP port space has failed due to all such ports being in use.

About this kind of error, if you read in a previous post, Ive already tried to declare the MaxPort in the registry but no success.
 
Upvote 0

marcick

Well-Known Member
Licensed User
Longtime User
Also I've tested this command in the powershell (found on internet searching for that error message)

B4X:
PS C:\Users\Administrator> Get-Counter -Counter \TCPv4\*

Timestamp                 CounterSamples
---------                 --------------
15/02/2019 16:33:35       \\gigpsweb\tcpv4\segments/sec :
                          66,9395503907234

                          \\gigpsweb\tcpv4\connections established :
                          26

                          \\gigpsweb\tcpv4\connections active :
                          10066

                          \\gigpsweb\tcpv4\connections passive :
                          44395

                          \\gigpsweb\tcpv4\connection failures :
                          10173

                          \\gigpsweb\tcpv4\connections reset :
                          40437

                          \\gigpsweb\tcpv4\segments received/sec :
                          20,9810531075402

                          \\gigpsweb\tcpv4\segments sent/sec :
                          45,9584972831832

                          \\gigpsweb\tcpv4\segments retransmitted/sec :
                          0

Does it really means I have in this moment 10066 connection active ? How it is possible ? I have less than 20 devices connected
I will monitor this again at the next failure
 
Upvote 0

OliverA

Expert
Licensed User
Longtime User
How much memory in the system? You actually increased the ports from 5000 to the 65534 in the registry? How about your firewall? What are you allowing to connect?
You may need to configure Windows Firewall to log connections. On how to see: https://docs.microsoft.com/en-us/pr...WindowsFirewallandconfigurethedefaultbehavior. Make sure you log is big enough and you log successful connections (not rejected ones - for now).

Does it really means I have in this moment 10066 connection active ?
Maybe not. See: https://social.technet.microsoft.co...uotperfmon-vs-netstatquot?forum=winserver8gen. The last answer has some another PowerShell command you can try for active connections and a netstat one.
 
Upvote 0

OliverA

Expert
Licensed User
Longtime User
Upvote 0

OliverA

Expert
Licensed User
Longtime User
Turn on the Windows Firewall logging and go from there. It may clue you in on what is going on, if all the connections are made to the ports you are expecting. It can be imported into excel for analysis (with space as the separator). Another article on how to turn int on a and what it provides; https://www.howtogeek.com/220204/how-to-track-firewall-activity-with-the-windows-firewall-log/. Also, just to make sure that your timeout timer is really for 5 minutes, instead of using 300000, you may want to use 5 * DateTime.TicksPerMinute.
 
Upvote 0

marcick

Well-Known Member
Licensed User
Longtime User
Ok OliverA, sorry I dint' answer completely

Yes, I have declared the MaxPort to 65535
I have opened the JRDC port 17179 and another port for WebSocket.
I'll study that article about firewall log

Thanks again.
 
Upvote 0

OliverA

Expert
Licensed User
Longtime User
I'm pretty sure the maximum number you can use is 65534. If you used 65535, Windows may not have changed anything. The key name is MaxUserPort.
 
Upvote 0

marcick

Well-Known Member
Licensed User
Longtime User
Hello, I have collected some info with firewall logging

During this night I had about 650.000 total incoming connections.
Most of them are to the port where I receive TCP data from the devices (but I wonder why they are so many, about 500.000)
According to the article you linked me, I should see for DROP connection with a destination address different from 255
And they are about 70.000 on ports 1900 and 5355. Looking to the inbound firewall rules, they are related to Network discovery.
Can you see anything of suspect in this ?

Nuova immagine bitmap.jpg
 
Upvote 0

OliverA

Expert
Licensed User
Longtime User
If you can sent me the log, I can analyze your traffic. I’m guessing you have a router between your server and the internet and that it only lets certain traffic to your server? You can pm me if you want me to look at your log(s).
 
Upvote 0

Daestrum

Expert
Licensed User
Longtime User
Just out of curiosity, how many threads are running in the JVM / OS when your app is in this error condition ?

I might be wrong, but I suspect a process/thread is allocating ports and never releasing them. A process/thread won't necessarily terminate just because the app that created it is terminated.
This could explain why there are no ports for the debugger when you restart the app.
 
Last edited:
Upvote 0

marcick

Well-Known Member
Licensed User
Longtime User
How can I see how many threads are running in the JVM / OS ?

@OliverA : I will pm you, thanks. It’s a cloud vps, I have no idea which kind of infrastructure there is behind.
 
Upvote 0

OliverA

Expert
Licensed User
Longtime User
Yes, this is a modified version of JRDC where I added ServerSocket to manage connection from some devices.
What port is the ServerSocket using?
 
Upvote 0
Top