KarlB
Member
I need to pass a float to JavaScript for a Google Chart gauge. I'm porting code from MIT App Inventor that works perfectly. It uses getWebViewString() to pass a parameter. Is there a B4A equivalent? I searched everything I could think of but could find no example in the forum.
Thanks!

Thanks!
App Inventor Version:
<html>
  <head>
    <script src="loader.js"></script>

    <script>

    var webString = 0;

    google.charts.load('current', {'packages':['gauge']});
    google.charts.setOnLoadCallback( drawChart );

    function drawChart() {

      var data = google.visualization.arrayToDataTable([
      ['Label', 'Value'],
      ['Vbat', webString]
      ]);

      var options = {
        min: 30, max: 44,
        yellowFrom: 42, yellowTo: 44,
        redFrom: 30, redTo: 32,
        minorTicks: 2,
        majorTicks: ['30', '32', '34', '36', '38','40', '42', '44']
      };

      var chart = new google.visualization.Gauge(document.getElementById('chart_div'));

      chart.draw(data, options);

      setInterval(function() {
        webString = window.AppInventor.getWebViewString();
        data.setValue(0, 1, webString );
        chart.draw(data, options);
       }, 1000);

}
     </script>
   </head>

  <body>
    <div id="chart_div" style="width: 170px; height: 175px;text-align: center;"></div>
  </body>
</html>
B4A Version:
<html>
<head>
<script type="text/javascript" src="https://www.gstatic.com/charts/loader.js"></script>
<script type="text/javascript">
var webString = 0;
google.charts.load('current', {'packages':['gauge']});
google.charts.setOnLoadCallback(drawChart);
function drawChart() {
var data = google.visualization.arrayToDataTable([
['Label', 'Value'],
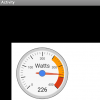
['Watts', webString]
]);
var options = {
min: 0, max: 400,
yellowFrom: 250, yellowTo: 350,
redFrom: 350, redTo: 400,
minorTicks: 5,
majorTicks: ['0', '', '100', '', '200','', '300', '','400']
};
var chart = new google.visualization.Gauge(document.getElementById('chart_div'));
chart.draw(data, options);
setInterval(function() {
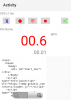
[[[How to pass a value from B4A to webString here?]]]
data.setValue(0, 1, webString);
chart.draw(data, options);
}, 3000);
}
</script>
</head>
<body>
<div id="chart_div" style="width: 400px; height: 120px;"></div>
</body>
</html>
B4A snipet:
Sub Globals
    'These global variables will be redeclared each time the activity is created.
    'These variables can only be accessed from this module.
    Dim WebView1 As WebView
End Sub

Sub Activity_Create(FirstTime As Boolean)

    Activity.LoadLayout("Main")
    Chart = File.GetText(File.DirAssets, "onegauge.html")
    WebView1.LoadHtml(Chart)
End Sub