Tutorial covering the new "Rapid Debugger" deployment mode is available here:
Rapid Debugger
This tutorial explains the debugging features added in Basic4android v1.50 as well as the other related tools.
The debug option is here:
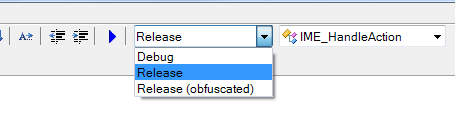
The debugging code allows the IDE to connect to the program and inspect it while it runs.
When the program starts it will wait for up to 10 seconds for the IDE to connect. Usually the IDE will connect immediately. However if you run your program manually from the phone you will see it waiting.
The name of the compiled APK file will end with _DEBUG.apk. You should not distribute this apk file as it contains the debugging code which adds a significant overhead.
When we run the program in debug mode the IDE will open the debugger module at the bottom of the screen:
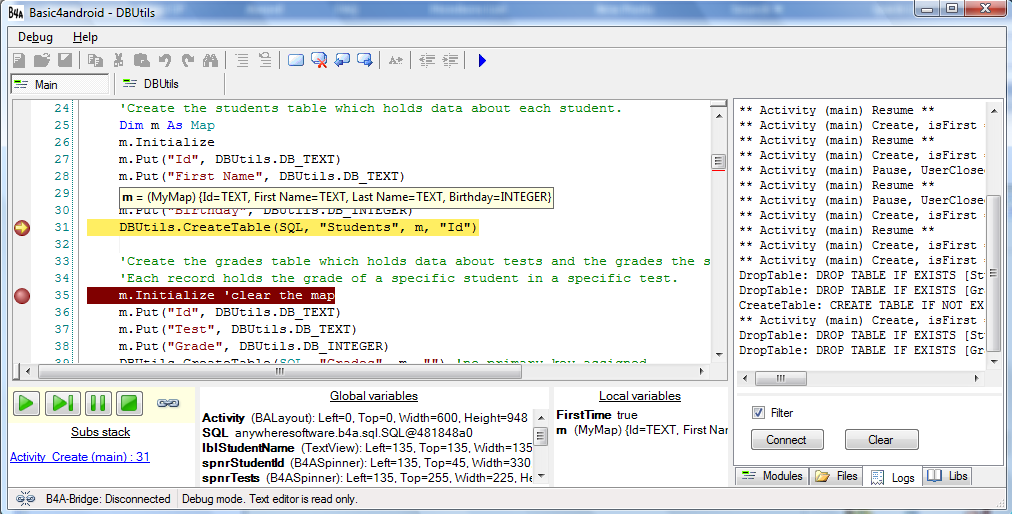
The debugging module contains three sections: subs stack, global variables and local variables. These sections show the data when the program is paused. Note that you can also see the variables data by hovering with the mouse over a variable name in the code.
Above the subs stack section there are useful buttons for continuing the execution, stepping to the next line, pausing execution and stopping the program. There is also an icon which tells us whether the debugger is connected. Double clicking on this icon will disconnect the debugger without killing the program.
Note that there is also a Debug menu which additionally includes Step Over (executes the next line without breaking on inner sub calls) and Step Out (gets out of the current sub and breaks) items.
The code editor is read only while the debugging module is visible.
Breakpoints - You can mark lines of codes as breakpoints. This is done by pressing on the grey area left of the line.
The program will pause when it reaches a breakpoint and will allow you to inspect the current state.
Logging - The Logs tab at the right pane is very useful. It shows messages related to the components life cycle and it can also show messages that are printed with the Log keyword. You should press on the Connect button to connect to the device logs. Note that there is a Filter checkbox. When it is checked you will only see messages related to your program. When it is unchecked you will see all the messages running in the system. If you are encountering an error and do not see any relevant message in the log, it is worth unchecking the filter option and looking for an error message.
Note that the log is maintained by the device. When you connect to a device you will also see previous messages.
Notes about the debugger:
- Breakpoints in the following subs will be ignored: Globals, Process_Globals and Activity_Pause.
- Services - Breakpoints that appear after a call to StartService will be ignored. Breakpoints set in Service_Create and Service_Start will pause the program for up to a specific time (about 12 seconds). This is to avoid the OS from killing the Service.
- Events that fire when the program is paused will be executed. Breakpoints in the event code will be ignored (only when the program is already paused).
- The data sent from the device to the IDE is limited in size. Long strings may be truncated.
Rapid Debugger
This tutorial explains the debugging features added in Basic4android v1.50 as well as the other related tools.
The debug option is here:
The debugging code allows the IDE to connect to the program and inspect it while it runs.
When the program starts it will wait for up to 10 seconds for the IDE to connect. Usually the IDE will connect immediately. However if you run your program manually from the phone you will see it waiting.
The name of the compiled APK file will end with _DEBUG.apk. You should not distribute this apk file as it contains the debugging code which adds a significant overhead.
When we run the program in debug mode the IDE will open the debugger module at the bottom of the screen:
The debugging module contains three sections: subs stack, global variables and local variables. These sections show the data when the program is paused. Note that you can also see the variables data by hovering with the mouse over a variable name in the code.
Above the subs stack section there are useful buttons for continuing the execution, stepping to the next line, pausing execution and stopping the program. There is also an icon which tells us whether the debugger is connected. Double clicking on this icon will disconnect the debugger without killing the program.
Note that there is also a Debug menu which additionally includes Step Over (executes the next line without breaking on inner sub calls) and Step Out (gets out of the current sub and breaks) items.
The code editor is read only while the debugging module is visible.
Breakpoints - You can mark lines of codes as breakpoints. This is done by pressing on the grey area left of the line.
The program will pause when it reaches a breakpoint and will allow you to inspect the current state.
Logging - The Logs tab at the right pane is very useful. It shows messages related to the components life cycle and it can also show messages that are printed with the Log keyword. You should press on the Connect button to connect to the device logs. Note that there is a Filter checkbox. When it is checked you will only see messages related to your program. When it is unchecked you will see all the messages running in the system. If you are encountering an error and do not see any relevant message in the log, it is worth unchecking the filter option and looking for an error message.
Note that the log is maintained by the device. When you connect to a device you will also see previous messages.
Notes about the debugger:
- Breakpoints in the following subs will be ignored: Globals, Process_Globals and Activity_Pause.
- Services - Breakpoints that appear after a call to StartService will be ignored. Breakpoints set in Service_Create and Service_Start will pause the program for up to a specific time (about 12 seconds). This is to avoid the OS from killing the Service.
- Events that fire when the program is paused will be executed. Breakpoints in the event code will be ignored (only when the program is already paused).
- The data sent from the device to the IDE is limited in size. Long strings may be truncated.
Last edited: