The so much awaited time is here, I have finally Updated the GraphView Library, there are some majors updates as the main jar file has been upgraded by the original author of this library.
This library is now complete, all methods and functions have been wrapped, although i have not fully tested it myself. I'am providing a small example to show some of the new features this library offers.
Note:
This library requires the AppCompat library done by Corwin42, thanks to him for this great library and it can be downloaded from here
AppCompat
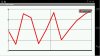
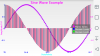
Line Series
BarGraph Series
Points Series
Source Code has been added for whoever wants to continue maintaining this library as I no longer have the time to do it.
I had to do a lot of digging to find the source code but here it is, it can be downloaded from the following link.
https://drive.google.com/open?id=1NyFzI5SvKsDA3wDNC8K5ksFKpb61SI5L
Version: 1.35
Hope you guys find this useful, compared to other methods found here in the forum i find this way easier to use, as it only requires a few lines of code.
Please feel free to post your comments, recommendations and feedback.
The Example i've put together can be downloaded from here:
GraphView Example
:Updated April 3rd, 2015
Complete library based on the new original jar file.
This library is now complete, all methods and functions have been wrapped, although i have not fully tested it myself. I'am providing a small example to show some of the new features this library offers.
Note:
This library requires the AppCompat library done by Corwin42, thanks to him for this great library and it can be downloaded from here
AppCompat
Line Series
BarGraph Series
Points Series
Source Code has been added for whoever wants to continue maintaining this library as I no longer have the time to do it.
I had to do a lot of digging to find the source code but here it is, it can be downloaded from the following link.
https://drive.google.com/open?id=1NyFzI5SvKsDA3wDNC8K5ksFKpb61SI5L
- With this new version you can use as many series as you wish (have not tested with more than 5 series)
- The option to use Dates in the X axis is now also available.
- This library allows you to have 2 Y Axis, it also includes a click listener for any Series you provide, you can click on any data point on the series and either show a toast message or log the data.
- Custom Label Formatter
- Change all Axis Text color and Text size
- Change Graph's Title color and Text size
- Live Graph
- Change Points series to Circular, Square and Triangle
- Display Data Point values on top of Bar graph series
- Change the legend's physical position (Top, Middle, Bottom)
- Many other options.......
Version: 1.35
- LineSeries
Events:- SeriesClicked (xdata as String As , ydata as String As )
- AppendData (x As Double, y As Double, viewportsize As Int)
Appends data to an already existing series, used to plot live Data, and sets the viewport size
Example
<code>
series.AppendData(x, y, 100)
</code> - DataPointRadius (series As LineGraphSeries, size As Int)
Sets the line series data Point radius
Example
<code>
series.DataPointRadius(series, 10)
</code> - DrawBackGroundColor (color As Int)
Sets the line series background color / the background color for the filling under the line.
Example
<code>
series.DrawBackGroundColor(colors.LightGray)
</code> - Initialize (eventName As String, title As String, color As Int, Dates As Boolean, xdata() As Double, ydata() As Double) As LineGraphSeries
- IsInitialized As Boolean
- ResetData (x() As Double, y() As Double) As DataPoint[]
Resets the x, and y axis data
<B>NOTE: Use only in Sub Activity_Resume
before appending any data to a series.</B>
Example
<code>
series.ResetData(xx, yy)
</code> - ShowDotDataPoints
Enables the DataPoints to be shown on the Line Series
Example
<code>
series.ShowDotDataPoints
</code> - ShowDottedLine (linecolor As Int, strokewidth As Int)
Changes the Line Series to a dotted line, sets the color and the stroke width
Example
<code>
series.ShowDottedLine(colors.Black, 15)
</code>
- PointGraphSeries
Events:- SeriesClicked (xdata as String As , ydata as String As )
- Initialize (eventName As String, title As String, color As Int, Dates As Boolean, xdata() As Double, ydata() As Double) As PointsGraphSeries
- IsInitialized As Boolean
- SetPointShape
Changes the Points Shape to round shape
Example
<code>
dim pointseries as PointGraphSeries
pointseries.Initialize("pointseries", "Points Series", colors.Blue, False, xx, yy)
pointseries.SetPointShape
</code> - SetRectangleShape
Changes the points Shape to Rectangle shape
Example
<code>
dim pointseries as PointGraphSeries
pointseries.Initialize("pointseries", "Points Series", colors.Blue, False, xx, yy)
pointseries.SetrectangleShape
</code> - SetTriangleShape
Changes the points Shape to Triangle Shape
Example
<code>
dim pointseries as PointGraphSeries
pointseries.Initialize("pointseries", "Points Series", colors.Blue, False, xx, yy)
pointseries.SetTriangleShape
</code>
- bargraphseries
Events:- SeriesClicked (xdata as String As , ydata as String As )
- BarSeriesSpacing (series As BarGraphSeries, spacing As Int)
Sets the Bar Series spacing
Example
<code>
dim barseries as bargraphseries
barseries.Initialize("barseries", "Bar Series", colors.Blue, False, xx, yy)
barseries.BarSeriesSpacing(50)
</code> - Initialize (eventName As String, title As String, color As Int, Dates As Boolean, xdata() As Double, ydata() As Double) As BarGraphSeries
- IsInitialized As Boolean
- showBarValues (series As BarGraphSeries, color As Int)
Enables the Y axis values on top of the Bar series and sets the text color
Example
<code>
dim barseries as bargraphseries
barseries.Initialize("barseries", "Bar Series", colors.Blue, False, xx, yy)
barseries.showBarValues(barseries, colors.Green)
</code>
- graph
Methods:- AddBarSeries (Dates As Boolean, SecondScale As Boolean, series() As Bargraphseries) As GraphView
Adds BarSeries to the graphview, it takes a boolean if using dates, a boolean if assigning the series to the second Y scale
Example
<code>
dim barseries as bargraphseries
dim xx(10) as double
dim yy(10) as double
for i = 0 to xx.lenght -1
xx(i) = i
yy(i) = i
next
barseries.Initialize("barseries", "Glucose Levels", Colors.Green, False, xx, yy)
graphview.AddBarseries(False, False, Array as bargraphseries(barseries))
</code> - AddLineSeries (Dates As Boolean, SecondScale As Boolean, series() As Lineseries) As GraphView
Adds series lines to the graphview, it takes a boolean if using dates, a boolean if assigning the series to the second Y scale
Example
<code>
dim series as lineseries
dim xx(10) as double
dim yy(10) as double
for i = 0 to xx.lenght -1
xx(i) = i
yy(i) = i
next
series.Initialize("series", "Glucose Levels", Colors.Blue, False, xx, yy)
graphview.AddLineSeries(False, False, Array as lineseries(series))
</code> - AddPointsSeries (Dates As Boolean, SecondScale As Boolean, series() As Pointgraphseries) As GraphView
Adds PointSeries to the graphview, it takes a boolean if using dates, a boolean if assigning the series to the second Y scale
Example
<code>
dim pointseries as pointseries
dim xx(10) as double
dim yy(10) as double
for i = 0 to xx.lenght -1
xx(i) = i
yy(i) = i
next
pointseries.Initialize("pointseries", "Glucose Levels", Colors.Red, False, xx, yy)
graphview.AddPointSeries(False, False, Array as pointgraphseries(pointseries))
</code> - FormatLabels (FractionDigits As Int, IntegerDigits As Int)
Format horizontal and vertical labels
Set number of fraction digits
Set number of Integer digits
Example
<code
>graphview.FormatLabels(2, 3)
</code> - HorizontalLabelColor (color As Int)
Sets the Horizontal scale label's text color
Example
<code>
graphview.HorizontalLabelColor(colors.Blue)
</code> - Initialize (title As String, Dates as Boolean) As GraphView
- IsInitialized As Boolean
- SetBackGroundColor (color As Int)
Sets the grids background color
<B>NOTE: There is an issue using this function when using two Y axis
Only use it if one Y Axis is being used.</B>
Example
<code>
graphview.SetBackGroundColor(colors.LightGray)
</code> - SetCustomLabel (sign As String)
Set custom labels on graphview
Example
<code>
graphview.SetCustomLabel("$")
</code> - SetGraphTitleColor (color As Int)
Sets the Graph's Title color
Example
<code>
graphview.SetGraphTitleColor(colors.Blue)
</code> - SetGraphTitleSize (size As Int)
Sets the Graph's Title size
Example
<code>
graphview.SetGraphTitleSize(50)
</code> - SetGraphViewTextSize (size As Float)
Sets the Horizontal, Vertical and Second Vertical Text size
Example
<code>
graphview.SetGraphViewTextSize(45)
</code> - SetGridStyletoBoth
Sets the graph's grid style to both Horizontal and Vertical
Example
<code>
graphview.SetGridStyletoBoth
</code> - SetGridStyletoHorizontal
Sets the graph's grid style to Horizontal only (only Horizontal line)
Example
<code>
graphview.SetGridStyltoHorizontal
</code> - SetGridStyletoNone
Sets the graph's grid style to None (No horizontal or vertical lines)
Example
<code>
graphview.SetGridStyletoNone
</code> - SetGridStyletoVertical
Sets the graph's grid style to Vertical only (only Vertical Line)
Example
<code>
graphview.SetGridStyletoVertical
</code> - SetHorizontalAxisTitle (title As String, color As Int)
Sets the Horizontal Axis Title and Color
Example
<code>
graphview.SetHorizontalAxisTitle("Time(s)", colors.Blue)
</code> - SetLegendAlignBottom
Sets the graph's Legend physical Position to the bottom
Example
<code>
graphview.SetLegendAlignBottom
</code> - SetLegendAlignMiddle
Sets the graph's Legend physical Position to the middle
Example
<code>
graphview.SetLegendAlighMiddle
</code> - SetLegendAlignTop
Sets the graph's Legend physical position to the top
Example
<code>
graphview.SetLegendAlignTop
</code> - SetLegendBackGroundColor (color As Int)
Sets the Legend's background color
Example
<code>
graphview.SetLegendBackGroundColor(colors.LightGray)
</code> - SetLegendMargin (margin As Int)
Sets the Legend's margin / margin from the edge of the box to the corner of the graphview
Example
<code>
graphview.SetLegendMargin(10)
</code> - SetLegendPadding (padding As Int)
Sets the Legend's padding / padding is the space between the edge of the box and the beginning of the text
Example
<code>
graphview.SetLegendPadding(20)
</code> - SetLegendSpacing (spacing As Int)
Sets the Legend's spacing / set the spacing between the text lines
Example
<code>
graphview.SetLegendSpacing(5)
</code> - SetLegendTextColor (color As Int)
Sets the text color of the legend labels.
Example
<code>
graphview.SetLegendTextColor(colors.LightGray)
</code> - SetLegendTextSize (textSize As Float)
Sets the graph's Legend's Text Size
Example
<code>
graphview.SetLegendTextszie(40)
</code> - SetLegendWidth (width As Int)
Sets the graph's Legend Width
Example
<code>
graphview.SetLegendWidth(100)
</code> - SetSecondYScaleColor (color As Int)
Sets the Second Y Scale label's color
Example
<code>
graphview.SetSecondYScaleColor(colors.Brown)
</code> - SetVerticalAxisTitle (title As String, color As Int)
Sets the Veritcal's Axis Title and Color
Example
<code>
graphview.SetVerticalAxisTitle("Force(lbs)", colors.Red)
</code> - VerticalLabelColor (color As Int)
Sets the Vertical scale label's text color
Example
<code>
graphview.VerticalLabelColor(colors.Magenta")
</code>
- AddBarSeries (Dates As Boolean, SecondScale As Boolean, series() As Bargraphseries) As GraphView
Hope you guys find this useful, compared to other methods found here in the forum i find this way easier to use, as it only requires a few lines of code.
Please feel free to post your comments, recommendations and feedback.
The Example i've put together can be downloaded from here:
GraphView Example
:Updated April 3rd, 2015
Complete library based on the new original jar file.
Attachments
Last edited: