B4i Library [module] Charts Framework

imbault

Well-Known Member
Licensed User
Longtime User
Sorry @Erel , I've put that code in the end of Application_Start,
GraphPanel is a panel created in the page designer, and impossible to see anything, what am I doing wrong?
in

Process_Globals

B4X:
Dim LD As LineData
Dim G As Graph

Dim GraphPanel As Panel


end of Application_Start
B4X:
TemperatureUnits = "F"

LD.Initialize

LD.Target = GraphPanel
Charts.AddLineColor(LD, Colors.Red) 'First line color

G.Initialize

G.Title = "Brew Kettle Temperature History"
G.XAxis = "Time"

If TemperatureUnits = "F" Then
    G.YAxis = "Deg. F"
    G.YStart = 0
    G.YEnd = 225
    G.YInterval = 25
Else If TemperatureUnits = "C" Then
    G.YAxis = "Deg. C"
    G.YStart = 0
    G.YEnd = 110
    G.YInterval = 10
End If

G.AxisColor = Colors.Black


G.AxisColor = Colors.Black


Thx

Patrick
 
Last edited:

JanPRO

Well-Known Member
Licensed User
Longtime User
Hi,

you can try narek's ImageZoom library, here is a modified CreatePieTab sub from the example:
B4X:
Sub CreatePieTab
    pnlPie.Initialize("pnlPie")
    pnlPie.Height = 100%Y
    pnlPie.Width = 100%X
    'pagePie.RootPanel.AddView(pnlPie, 0, 0, 100%x, 100%y)
    Dim PD As PieData
    PD.Initialize
    PD.Target = pnlPie 'Set the target view
    'Add the items. The last parameter is the color. Passing 0 will make it a random color.
    Charts.AddPieItem(PD, "Item #1", 120, 0)
    Charts.AddPieItem(PD, "Item #2", 25, 0)
    Charts.AddPieItem(PD, "Item #3", 50, 0)
    Charts.AddPieItem(PD, "Item #4", 190, 0)
    Charts.AddPieItem(PD, "Item #5", 350, 0)
    PD.GapDegrees = 20 'Total size of gaps between slices. Set to 0 for no gaps.
    PD.LegendBackColor = Colors.ARGB(50, 100, 100, 100) 'The background color of the legend bitmap.

    Dim ImageView1 As ImageView = Charts.DrawPie(PD, Colors.White, True)
    pnlPie.AddView(ImageView1, 10dip, 10dip, ImageView1.Width, ImageView1.Height)
  
    Dim Cv As Canvas
    Cv.Initialize(pnlPie)
  
    Dim ImgZoom As ImageZoom
    ImgZoom.Initialize(Cv.CreateBitmap)
    ImgZoom.AddToView(pagePie.RootPanel,0,0,100%x, 100%y)
  
End Sub
Jan
 

Taha

Member
Licensed User
Longtime User
Great. DrawPie return ImageView. But DrawLinesChart doesn't.
 

JanPRO

Well-Known Member
Licensed User
Longtime User
Hi,

the ImageView isn't important.
Important is the Panel which is the Target of the Bar-/Line-/Pie-Data. We are using this Panel, which includes the created chart, and create with the help of a canvas a bitmap of it.
No we can use the ImageZoom library with the bitmap.
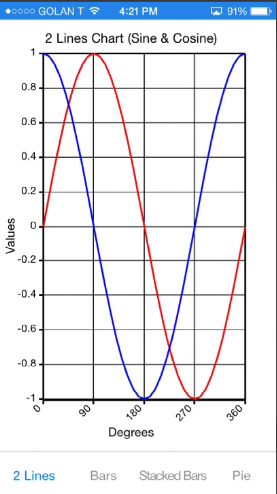
Here is the modified Create2LinesTab Sub:
B4X:
Sub Create2LinesTab
    pnl2Lines.Initialize("pnl2Lines")
    pnl2Lines.Height = 100%Y
    pnl2Lines.Width = 100%X
    'pageLine.RootPanel.AddView(pnl2Lines, 0, 0, 95%x, 100%y)
    Dim LD As LineData
    LD.Initialize
    LD.Target = pnl2Lines
    Charts.AddLineColor(LD, Colors.Red) 'First line color
    Charts.AddLineColor(LD, Colors.Blue) 'Second line color
    For i = 0 To 360 Step 10
        'In this case we are adding an array of two values. One for each line.
        'Make sure to create an array for each point. You cannot reuse a single array for all points.
        Charts.AddLineMultiplePoints(LD, i, Array As Float(SinD(i), CosD(i)), i Mod 90 = 0)
    Next
    Dim G As Graph
    G.Initialize
    G.Title = "2 Lines Chart (Sine & Cosine)"
    G.XAxis = "Degrees"
    G.YAxis = "Values"
    G.YStart = -1
    G.YEnd = 1
    G.YInterval = 0.2
    G.AxisColor = Colors.Black
    Charts.DrawLineChart(G, LD, Colors.White)
   
    Dim Cv As Canvas
    Cv.Initialize(pnl2Lines)
 
    Dim ImgZoom As ImageZoom
    ImgZoom.Initialize(Cv.CreateBitmap)
    ImgZoom.AddToView(pageLine.RootPanel,0,0,100%x, 100%y)
End Sub

Jan
 

Taha

Member
Licensed User
Longtime User
Thanks, Jan! I tried and it worked, very good to know. However the zoom is not as good as for Android library (zoom by axis).
 
Cookies are required to use this site. You must accept them to continue using the site. Learn more…