B4A Library [B4X] ediChart A library for creating PIE charts with rounded edges & Piramid Chart & More

This library allows you to create bar charts simply by adding a list of values. Examples are included in b4a and b4j.
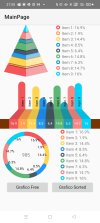
You can now create 3 types of charts: animated pie charts with rounded edges, vertical bar charts with depth effects, and pyramid charts.

The library is provided as b4xlib, but I do not authorize its decompilation.

All code is pure b4x.

EdiChart
Autor: Valerio Dossetto
Versione: 1.03


Schermata 2025-07-23 213812.png
Screenshot_2025-07-23-21-50-26-83_be4928b8e3d3ad983291bc00c6d982dd.jpg
Screenshot 2025-07-25 114108.png

Screenshot 2025-07-25 163637.png
Screenshot 2025-07-26 125049.png


Sample use:
Private Sub Button2_Click

    Dim lista As List
    lista.Initialize
    Dim num1 As Int
    num1=(Rnd(3,13))
    For i = 1 To num1
        Dim e As Elemento
        e.Initialize
        e.Nome = "Item " & i
        e.Valore = Rnd(10, 200)
        lista.Add(e)
    Next
    'not sorted
    ediPiramidChart1.Grafico(lista,False)
    ediBarRound3d1.Grafico(lista,False)
    EdiPieChart21.GraficoAnimato(lista,False)
End Sub


Private Sub Button1_Click
    Dim lista As List
    lista.Initialize
    Dim num1 As Int
    num1=(Rnd(3,13))
    For i = 1 To num1
        Dim e As Elemento
        e.Initialize
        e.Nome = "Item " & i
        e.Valore = Rnd(10, 200)
        lista.Add(e)
    Next
    'sorted
    ediPiramidChart1.Grafico(lista,True)
    ediBarRound3d1.Grafico(lista,True)
    EdiPieChart21.GraficoAnimato(lista,True)

End Sub


Change log
  • 1.00
    • Initial release
  • 1.01
    • Add ediPiramidChart
      Add ediBarRound3d
      Changed the order of the colors
  • 1.02
    • Add animation
    • Clear variables and definitions
    • Update demo
    • Add ediBar3d (dark & Light)
  • 1.03
    • Add ediBar
    • Add ediPiramidGlass


I spend a lot of time creating components like this, and creating a library takes a lot of time. If you'd like to support me and add more libraries, you can do so here via PayPal or with a coffee. :)

btn_donateCC_LG.gif
 

Attachments

  • Screenshot_2025-07-23-21-50-26-83_be4928b8e3d3ad983291bc00c6d982dd.jpg
    Screenshot_2025-07-23-21-50-26-83_be4928b8e3d3ad983291bc00c6d982dd.jpg
    434.8 KB · Views: 80
  • EdiChart.b4xlib
    30.7 KB · Views: 46
  • Project.zip
    167.4 KB · Views: 36
Last edited:

TILogistic

Expert
Licensed User
Longtime User
Great work.
One observation when reviewing the classes: there are variables and definitions that aren't used. Another point: use more animation in the graphics using what you already have (easing functions) or use them when generating the pie chart.
Congratulations!
 
Last edited:

valerioup

Member
Licensed User
Longtime User
I updated the example by saving with the Ctrl key held down and clicking the commented link at the top of the b4xMainPage code; it wasn't intuitive.

It should now be usable, and there's a single zip file.
 
Last edited:

valerioup

Member
Licensed User
Longtime User
I'm creating other types of graphics; if anyone is interested, please contact me privately. This is my new work. Always done with B4Xbitmap and pure canvas.

The graph can be created animated with and without legend

Screenshot 2025-07-24 213810.png
Screenshot 2025-07-24 213829.png
Screenshot 2025-07-24 225205.png


glass effect with transparencies and animations.
 
Last edited:

Theera

Expert
Licensed User
Longtime User
I'm not good at English. Thank for your Italian version😆🤣🤣
 
Last edited:

valerioup

Member
Licensed User
Longtime User
Great work.
One observation when reviewing the classes: there are variables and definitions that aren't used. Another point: use more animation in the graphics using what you already have (easing functions) or use them when generating the pie chart.
Congratulations!
I cleaned up the variables and added animations, as well as a new chart type. I've updated the example.
For those who have already used the examples and the library, remember to open the design and resave the screens as custom properties have been added to the charts. Without this step, problems may occur.
 

TILogistic

Expert
Licensed User
Longtime User
Tip:
Try to use B4XView (cross-platform XUI) whenever possible, in panels, labels, etc.
Great work!
 
Top