Android Question Plot points and slide them to the left

Pablo Torres

Active Member
Licensed User
Longtime User
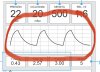
Hi, I have a Tablet connected to an arduino that is sending to the tablet data (one value) 50 times per second. I have to show that data in the tablet, and it has to look like the red part in the image below.
Now, the question is, how can I “add” new point to the left, erase first point of the right and slide all the points exactly 1 point to the left... and refresh it 50 times per second?

I will appreciate any help
Thank you all very much
 

Attachments

  • 3506B87C-F2F9-4F01-9A5E-D6379E9EB05D.jpeg
    3506B87C-F2F9-4F01-9A5E-D6379E9EB05D.jpeg
    394.1 KB · Views: 210

Brian Dean

Well-Known Member
Licensed User
Longtime User
... and slide all the points exactly 1 point to the left...

Are you sure that is what you really want to do? Because I don't think that you will see anything except a band of noise. It will not look like the waveform that you show in your attachment. Real oscilloscipes (both analogue and digital) draw the waveform from left to right, then erase the screen and draw a new trace. Are are you trying something new? Surely you need to set a trigger value, just as in a real oscilloscope, to provide a repetitive reference point, and then add points from left to right.
 
Upvote 0

Brian Dean

Well-Known Member
Licensed User
Longtime User
... then erase the screen and draw a new trace.

Forget about that bit for a digital 'scope. Keep a list of the point values on each traverse. Then, on the next sweep, remove the previously plotted points , replacing them one-by-one with the new (although prabably the same) value.
 
Upvote 0

klaus

Expert
Licensed User
Longtime User
You could use the xChart b4xlib library with a Line chart.
Attached a small B4A project showing the possibility.
You need to add the xChart.b4xlib to the \AdditionalLibraries\B4X folder and chsck it in the Libraries Manager Tab in the IDE.
 

Attachments

  • TestDynamicChart.zip
    10.1 KB · Views: 256
Upvote 0
Top